
2017-12-13 »
An epic treatise on scheduling, bug tracking, and triage
- [Note 2017-12-29: the news.ycombinator.com
discussion of this post is unusually useful. You may want to read it
first.]
- [Note 2018-09-01: I presented an
updated and shortened version of this talk at SREcon EMEA 2018. There's a
recording and some slides that you might enjoy. The text below is much more
detailed though, if you want to actually implement the advice.]
I did a talk at work about the various project management troubles I've seen through the years. People seemed to enjoy it a lot more than I expected, and it went a bit viral among co-workers. It turns out that most of it was not particularly specific to just our company, so I've taken the slides, annotated them heavily, and removed the proprietary bits. Maybe it'll help you too.
Sorry it got... incredibly long. I guess I had a lot to say!
[Obligatory side note: everything I post to this site is my personal opinion, not necessarily the opinion of my or probably any other employer.]
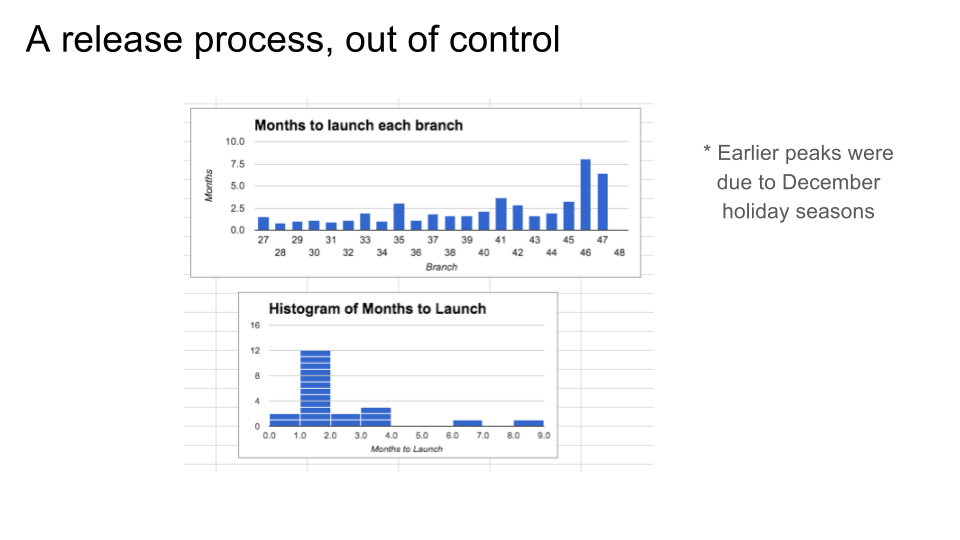 Way back in 2016, we were having some trouble getting our team's releases out the door. We also had out-of-control
bug/task queues and no idea when we'd be done. It was kind of a mess, so I
did what I do best, which is plotting it in a spreadsheet. (If what I do best was actually solving the problem, I assume
they'd have to pay me more.)
Way back in 2016, we were having some trouble getting our team's releases out the door. We also had out-of-control
bug/task queues and no idea when we'd be done. It was kind of a mess, so I
did what I do best, which is plotting it in a spreadsheet. (If what I do best was actually solving the problem, I assume
they'd have to pay me more.)
Before 2016 though, we had been doing really quite well. As you can see, our average time between releases was about two months, probably due primarily to my manager's iron fist. You might notice that we had some periodic slower releases, but when I looked into them, it turned out that they crossed over the December holiday seasons when nobody did any work. So they were a little longer in wall clock time, but maybe not CPU time. No big deal. Pretty low standard deviation. Deming would be proud. Or as my old manager would say, "Cadence trumps mechanism."
What went wrong in 2016? Well, I decided to find out. And now we're finally getting to the point of this presentation.
But before we introspect, let's extrospect!
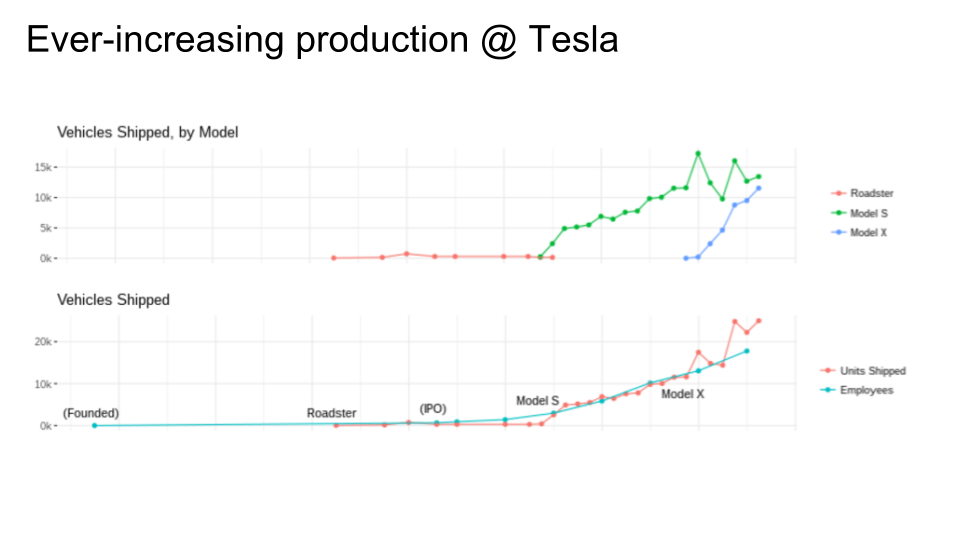
Here's a trend from a randomly selected company. I wanted to see how other companies scale up, so I put together a little analysis of Tesla's production (from entirely public sources, by the way; beware that I might have done it completely wrong). The especially interesting part of this graph (other than how long they went while producing only a tiny number of Roadsters and nothing else) is when they released the Model X. Before that, they roughly scaled employees at almost the same rate as they scaled quarterly vehicle production. With the introduction of the Model X, units shipped suddenly went up rapidly compared to number of employees, and sustained at that level.
I don't know for sure why that's the case, but it says something about improved automation, which they claim to have further improved for the Model 3 (not shown because I made this graph earlier in the year, and anyway, they probably haven't gotten the Model 3 assembly straightened out yet).
Tesla is a neat example of working incrementally. When they had a small number of people, they built a car that was economical to produce in small volumes. Then they scaled up slowly, progressively fixing their scaling problems as they went toward slightly-less-luxury car models. They didn't try to build a Model 3 on day 1, because they would have failed. They didn't scale any faster than they legitimately could scale.
 So naturally I showed the Tesla plot to my new manager, who looked at it and asked the above question.
Many people groan when they hear this question, but I think we should give credit where credit is due. Many tech companies are based around the idea that if you hire the smartest people, and remove all the obstacles you can, and get rid of red tape, and just let them do what they feel they need to do, then you'll get better results than using normal methods with normal people. The idea has obviously paid off hugely at least for some companies. So the idea of further boosting performance isn't completely crazy. And I did this talk for an Engineering Productivity team, whose job is, I assume, literally to make the engineers produce more.
But the reason people groan is that they take this suggestion in the most basic way: maybe we can just have the engineers work weekends or something? Well, I think most of us know that's a losing battle. First of all, even if we could get engineers to work, say, on Saturdays without any other losses (eg. burnout), that would only be a 20% improvement. 20%? Give me a break. If I said I was going to do a talk about how to improve your team's efficiency by 20%, you wouldn't even come. You can produce 20% more by hiring one more person for your 5-person team, and nobody even has to work overtime. Forget it.
The above is more or less what I answered when I was asked this question. But on the other hand, Tesla is charging thousands of dollars for their "optional" self-driving feature (almost everybody opts for it), which they've been working on for less time with fewer people than many of their competitors. They must be doing something right, efficiency wise, right?
Yes. But the good news is I think we can fix it without working overtime. The bad news is we can't just keep doing what we've been doing.
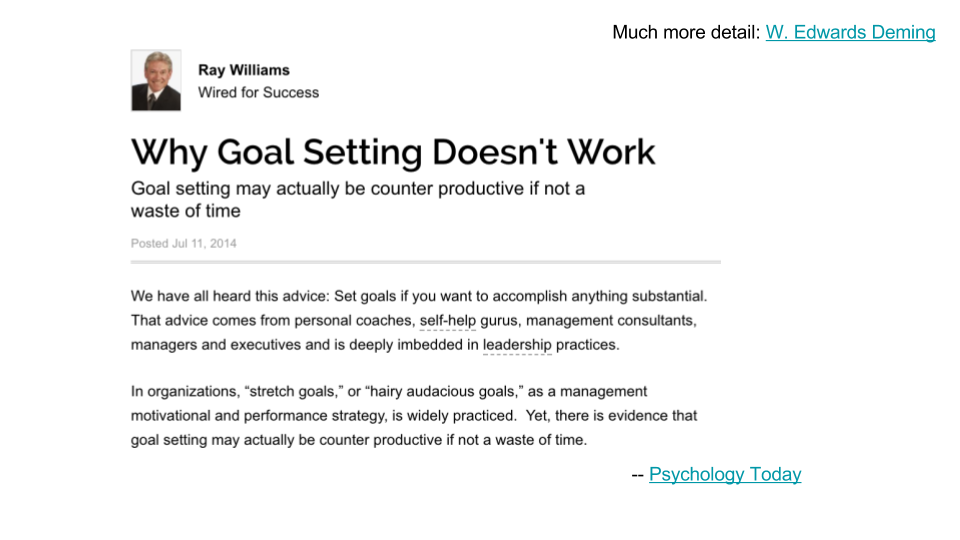
Here's one thing we can't keep doing. Regardless of what you think of Psychology Today (which is where I get almost all my dubiously sourced pop psychology claims; well, that and Wikipedia), there's ample indication from Real Researchers, such as my hero W. Edwards Deming, that says "setting goals" doesn't actually work and can make things worse.
Let's clarify that a bit. It's good to have some kind of target, some idea of which direction you're going. What doesn't work is deciding when you're going to get there. Or telling salespeople they need to sell 10% more next quarter. Or telling school teachers they need to improve their standardized test scores. Or telling engineers they need to launch their project at Whatever Conference (and not a day sooner or a day later).
What all these bad goals have in common is that they're arbitrary. Some supposedly-in-charge executive or product manager just throws out a number and everyone is supposed to scramble to make it come true, and we're supposed to call that leadership. But anybody can throw out a number. Real leaders have some kind of complicated thought process that leads to a number. And the thought process, once in place, actually gives them the ability to really lead, and really improve productivity, and predict when things really will be done (and make the necessary changes to help them get done sooner). Once they have all that, they don't really need to tell you an arbitrary deadline, because they already know when you'll finish, even if you still don't.
When it works, it all feels like magic. Do you suspect that your competitors are doing magic when they outdo you with fewer people and less money? It's not magic.
I just talked about why goals don't really help. This is a quote about how they can actually hurt, because of (among other things) a famous phenomenon called the "Student Syndrome." (By the way, the book this is taken from, Critical Chain, is a great book on project management.)
We all know how it works. The professor says you have an assignment due in a week. Everyone complains and says that's impossible, so the prof gives them an extension of an extra week. Then everyone starts work the night before anyway, so all that extra time is wasted.
That's what happens when you give engineers deadlines, like launching at Whatever Conference. They're sure they can get done in that amount of time, so they take it easy for the first half. Then they get progressively more panicked as the deadline approaches, and they're late anyway, and/or you ship on time and you get what Whatever Conference always gets, which is shoddy product launches. This is true regardless of how much extra time you give people. The problem isn't how you chose the deadline, it's that you had a deadline at all.
Stop and think about that a bit. This is really profound stuff. (By the way, Deming wrote things like this about car manufacturers in the 1950s, and it was profound then too.) We're not just doing deadlines wrong, we're doing it meta-wrong. The whole system is the wrong system. And there are people who have known that for 50+ years, and we've ignored them.
I wanted to throw this in too. It's not as negative as it sounds at first. SREs (Site Reliability Engineers) love SLOs (Service Level Objectives). We're supposed to love SLOs, and hate SLAs (Service Level Agreements). (Yes, they're different.) Why is that?
Well, SREs are onto something. I think someone over there read some of Deming's work. An SLA requires you to absolutely commit to hitting a particular specification for how good something should be and when, and you get punished if you miss it. That's a goal, a deadline. It doesn't work.
An SLO is basically just a documented measurement of how well the system typically works. There are no penalties for missing it, and everyone knows there are no penalties, so they can take it a bit easier. That's essential. The job of SRE is, essentially, to reduce the standard deviation and improve the average of whatever service metric they're measuring. When they do, they can update the SLO accordingly.
And, to the point of my quote above, when things suddenly get worse - when the standard deviation increases or the average goes in the wrong direction - the SLO is there so that they can monitor it and know something has gone wrong.
(An SLI - Service Level Indicator - is the thing you measure. But it's not useful by itself. You have to monitor for changes in the average and standard deviation, and that's essentially the SLO.)
I think it's pretty clear that SRE is a thing that works. SLOs give us some clues about why:
-
SLOs are loose predictions, not strict deadlines.
-
SLOs are based on measured history, not arbitrary targets thrown out by some executive.
We need SLOs for software development processes, essentially.
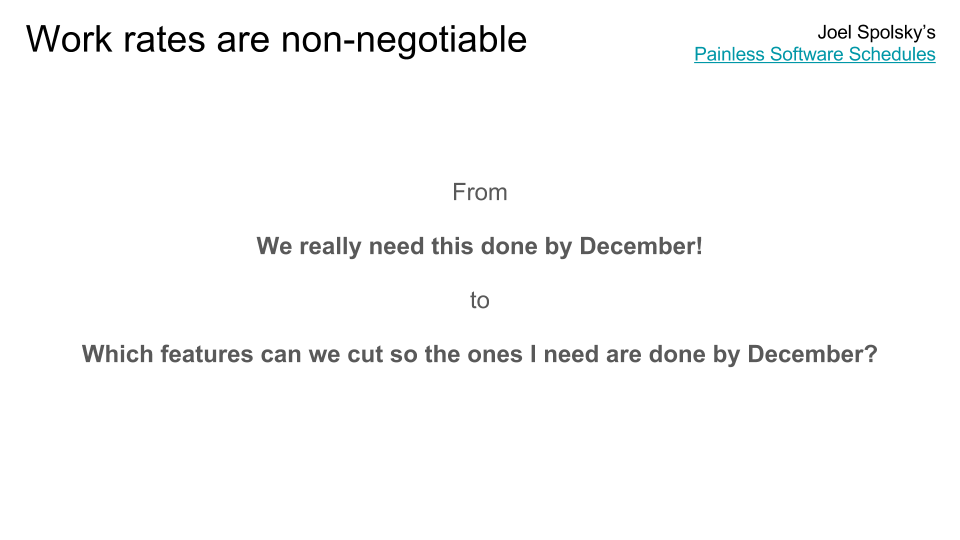
That was a bunch of philosophy. Let's switch to psychology. My favourite software psychologist is Joel Spolsky, of the famous Joel on Software blog. Way back in the early 2000s, he wrote a very important post called "Painless Software Schedules," which is the one I've linked to above. If you follow the link, you'll see a note at the top that he no longer thinks you should take his advice and you should use his newfangled thing instead. I'm sure his newfangled thing is very nice, but it's not as simple and elegant as his old thing. Read his old thing first, and worry about the new thing later, if you have time.
One of my favourite quotes from that article is linked above. More than a decade ago, at my first company, I was leading our eng team and I infamously (for us) provided the second above quote in response.
What Joel meant by "psychological games" was managers trying to negotiate with engineers about how long a project would take. These conversations always go the same way. The manager has all the power (the power to fire you or cancel your bonus, for example), and the engineer has none. The manager is a professional negotiator (that's basically what management is) and the engineer is not. The manager also knows what the manager wants (which is the software to be done sooner). The engineer has made an estimate off the top of their head, and is probably in the right ballpark, but not at all sure they have the right number. So the manager says, "Scotty, we need more power!" and the engineer says, "She canna take much more o' this, captain!" but somehow pulls it off anyway. Ha ha, just kidding! That was a TV show. In real life, Scotty agrees to try, but then can't pull it off after all and the ship blows up. That manager's negotiation skills have very much not paid off here. But they sure psyched out the engineer!
In my silly quote, the psychological games I'm talking about are the ones you want to replace that with. Motivation is psychological. Accurate project estimation is psychological. Feature prioritization is psychological. We will all fail at these things unless we know how our minds work and how to make them do what we want. So yes, we definitely need to play some psychological games. Which brings us to Agile.
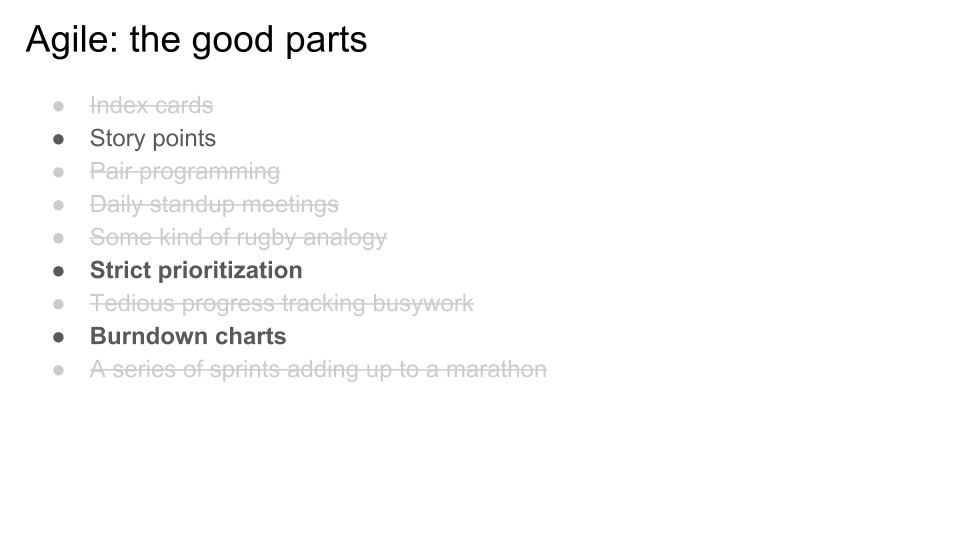 I know you probably think Agile is mostly cheesy. I do too. But the problem is, the techniques really work. They are almost all psychological games. But the games aren't there to make you work harder, they're there, to use an unfortunate cliche, to make you work smarter. What are we doing that needs smartening? If we can answer that, do we need all the cheesy parts? I say, no. Engineers are pretty smart. I think we can tell engineers how the psychological games work, and they can find a way to take the good parts.
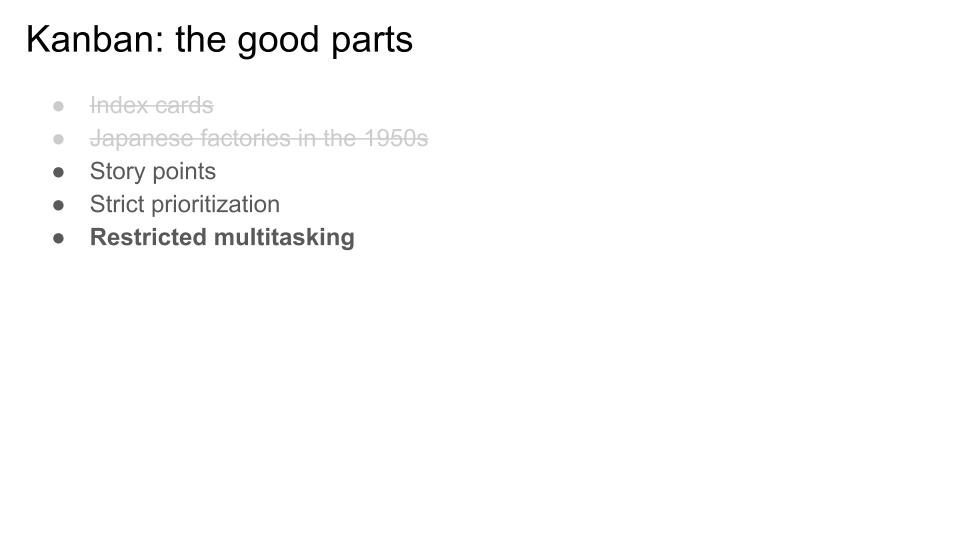
But let's go through all the parts just to be clear.
-
Physical index cards. There are reasons these are introduced into Agile: they help people feel like a feature is a tangible thing. They are especially good for communicating project processes with technophobes. (You can get your technophobic customers to write down things they want on index cards more easily than you can get them to use a bug tracking system.) Nowadays, most tech companies don't have too many technophobic employees. They also often have many employees in remote offices, and physical cards are a pain to share between offices. The fedex bills would be crazy. Some people try to use a tool to turn the physical cards into pictures of virtual physical cards, which I guess is okay for what it is, but I don't think it's necessary. We just need a text string that represents the feature.
-
Stories & story points. These turn out to be way more useful than you think. They are an incredibly innovative and effective psychological game, even if you don't technically write them as "stories." More on that in a bit.
-
Pair programming. Sometimes useful, especially when your programmers are kinda unreliable. They're like a real-time code review, and thus reduce latency. But mostly not actually something most people do, and that's fine.
-
Daily standup meetings. Those are just overhead. Agile, surprisingly enough, is not good because it makes you do stupid management fluff every day. It does, but that's not why it's good. We can actually leave out 95% of the stupid management fluff. The amazing thing about Agile is actually that you get such huge gains despite the extra overhead gunk it adds.
-
Rugby analogies (ie. SCRUM). Not needed. I don't know who decided sports analogies were a reliable way to explain things to computer geeks.
-
Strict prioritization. This is a huge one that we'll get to next - and so is flexible prioritization. Since everyone always knows what your priorities are (and in Agile, you physically post index cards on the wall to make sure they all know, but there are other ways), then people are more likely to work on tasks in the "right" order, which gets features done sooner than you can change your mind. Which means when you do change your mind, it'll be less expensive. That's one of the main effects of Agile. Basically, if you can manage to get everyone to prioritize effectively, you don't need Agile at all. It just turns out to be really hard.
-
Tedious progress tracking: also not needed. See daily standups, above. Agile accrues a lot of cruft because people take a course in it and there's inevitably a TPM (Technical Programme Manager, aka Project Manager) or something who wants to be useful by following all the steps and keeping progress spreadsheets. Those aren't the good parts. If you do this right, you don't even need a TPM, because the progress reports write themselves. Sorry, TPMs.
-
Burndown charts. Speaking of progress reporting, I don't think I'd heard of burndown charts before Agile. They're a simple idea: show the number of bugs (or stories, or whatever) still needing to be done before you hit your milestone. As stories/bugs/tasks/whatever get done, the line goes down, a process which we call "burning" because it makes us feel like awesome Viking warlords instead of computer geeks. A simple concept, right? But when you do it, the results are surprising, which we'll get to in a moment. Burndown charts are our fundamental unit of progress measurement, and the great thing is they draw themselves so you don't need the tedious spreadsheet.
-
A series of sprints, adding up to a marathon. This is phrased maybe too cynically (just try to find a marathon runner that treats a marathon as a series of sprints), but that's actually what Agile proposes. Sprints are very anti-Deming. They encourage Student Syndrome: putting off stuff until each sprint is almost over, then rushing at the end, then missing the deadline and working overtime, then you're burnt out so you rest for the start of the next sprint, and repeat. Sprints are also like salespeople with quarterly goals that they have to hit for their bonus. Oh, did I just say goals? Right, sprints are goals, and goals don't work. Let's instead write software like marathon runners run marathons: at a nice consistent pace that we can continue for a very long time. Or as Deming would say, minimize the standard deviation. Sprints maximize the standard deviation.
 Phew! Okay, that was wordy. Let's draw a picture.
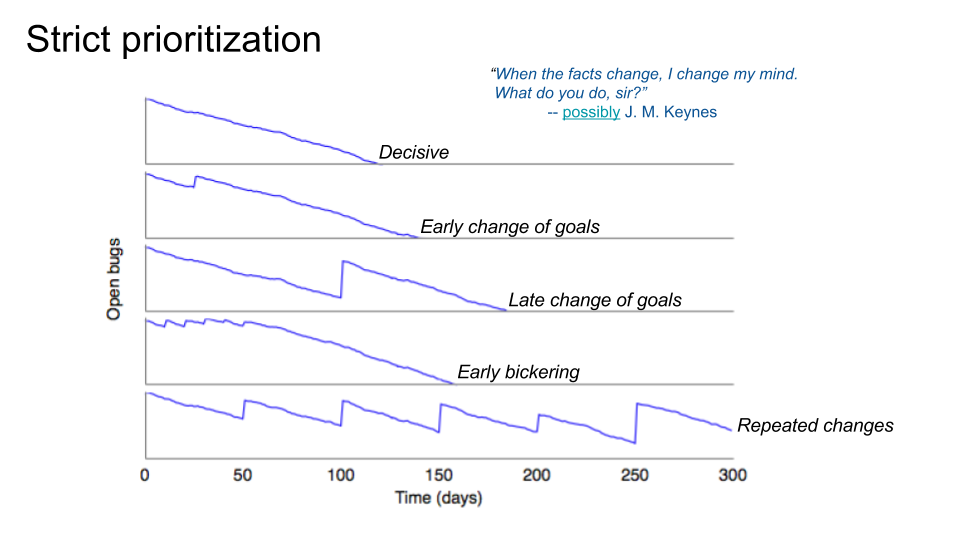
I made a SWE simulator that sends a bunch of autonomous SWE (software engineer) drones to work on a batch of simulated bugs (or subtasks). What we see are five simulated burndown charts. In each of the five cases, the same group of SWEs works on the exact same bug/task database, which starts with a particular set of bug/tasks and then adds new ones slowly over time. Each task has a particular random chance of being part of a given feature. On average, a task is included in ~3 different features. Then the job of the product managers (PMs) is to decide what features are targeted for our first milestone. For the simulation, we assume the first milestone will always target exactly two features (and we always start with the same two).
The release will be ready when the number of open tasks for the two selected features hits zero.
Interestingly, look at how straight those downward-sloping lines are. Those are really easy to extrapolate. You don't even need a real simulator; the simulator is just a way of proving that the simulator is not needed. If the simulator were an AI, it would be having an existential crisis right now. Anyway, those easy-to-extrapolate lines are going to turn out to be kind of important later.
For now, note the effect on release date of the various patterns of PMs changing their minds. Each jump upward on the chart is caused by a PM dropping one feature from the release, and swapping in a new one instead. It's always drop one, add one. The ideal case is the top one: make up your mind at the start and let people finish. That finishes the soonest. The second one is unfortunate but not too bad: they change their mind once near the start. The third chart shows how dramatically more expensive it is to change your mind late in the game: we drop the same feature and add the same other feature, but now the cost is much higher. In fact, the cost is much higher than changing their minds multiple times near the beginning, shown in the fourth chart, where we make little progress at all during the bickering, but then can go pretty fast. And of course, all too common, we have the fifth chart, where the PMs change their minds every couple of months (again, dropping and adding one feature each time). When that happens, we literally never finish. Or worse, we get frustrated and lower the quality, or we just ship whatever we have when Whatever Conference comes.
The purported quote near the top, "When the facts change, I change my mind," I included because of its implied inverse: "When the facts don't change, I don't change my mind." One of the great product management diseases is that we change our minds when the facts don't. There are so many opinions, and so much debate, and everyone feels that they can question everyone else (note: which is usually healthy), that we sometimes don't stick to decisions even when there is no new information. And this is absolutely paralyzing.
If you haven't even launched - in the picture above, you haven't even hit a new release milestone - then how much could conditions possibly have changed? Sometimes a competitor will release something unexpected, or the political environment will change, or something. But usually that's not the case. Usually, as they don't say in warfare, your strategy does survive until first contact with the enemy (er, the customer).
It's when customers get to try it that everything falls out from under you.
But when customers get to try it, we've already shipped! And if we've been careful only to work on shipping features until then, when we inevitably must change our minds based on customer feedback, we won't have wasted much time building the wrong things.
If you want to know what Tesla does right and most of us do wrong, it's this: they ship something small, as fast as they can. Then they listen. Then they make a decision. Then they stick to it. And repeat.
They don't make decisions any better than we do. That's key. It's not the quality of the decisions that matters. Well, I mean, all else being equal, higher quality decisions are better. But even if your decisions aren't optimal, sticking to them, unless you're completely wrong, usually works better than changing them.
If you only take one thing away from reading this talk, it should be that. Make decisions and stick to them.
Now, about decision quality. It's good to make high quality decisions. Sometimes that means you need to get a lot of people involved, and they will argue, and that will take some time. Okay, do that. But do it like chart #4, where the PMs bicker for literally 50 days straight and we run in circles, but the launch delay was maybe 30 days, less than the 50 you spent. Get all the data up front, involve all the stakeholders, make the best decision you can, and stick to it. That's a lot better than chart #3 (just a single change in direction!) or #5 (blowing in the wind).
 Sorry for the rant in that last slide. Moving on, we have more ideas to steal, this time from Kanban.
For people who don't know, Kanban was another thing computer people copied from Japanese car manufacturers of the 1950s. They, too, used actual paper index cards, although they used them in a really interesting way that you can read about in wikipedia if you care. You don't have to, though, because Kanban for software engineers doesn't use the index cards the same way, and as with Agile, I'm going to tell you to skip the paper cards anyway and do something digital, for the sake of your remote officemates. But Kanban for software uses the paper cards differently than Agile for software, and that's relevant, which we'll address in the next slide.
Kanban (for software) also uses stories and story points, just like Agile. Nothing much new there. (The car manufacturers in the 1950s didn't use stories. That's a new thing.)
Kanban, like Agile, gives the huge benefit of strict prioritization. It does it differently from Agile though. Where Agile tries to convince you to do things in a particular order, Kanban emphasizes doing fewer things at a time. Kanban is the basis of Just-in-Time (JIT) factory inventory management. Their insight is that you don't bother producing something until right before you need it, because inventory is expensive: not just for storage (which in our software analogy, is pretty cheap) but in wasted time when you inevitably turn out to have produced the wrong thing. And worse, in wasted time when you produced the right thing, but it didn't get used for another 6 months, and it broke in the meantime so you had to fix it over and over.
Going back to Critical Chain, that book will tell you the big secret of Kanban for software: unreleased software is inventory. It's very expensive, it slowly rusts in the warehouse, and worst of all, it means you produced work in the wrong order. You shouldn't have been doing something that wouldn't be needed for six months. You should have either been a) helping with the thing that's needed right now, or b) lounging around in the microkitchen reading books and eating snacks. Your buildup of low-priority inventory is slowing down the people working on the high-priority things, and that's unacceptable.
The classic example of this in Kanban for software is that we break software down into phases, say, requirements, UX design, software design, implementation, testing, etc. Let's say the TL (Tech Lead) is responsible for designing stuff, and the rest of the engineers are responsible for implementing it (the classic story of a TL who used to code but now mostly has meetings). The engineering team has a lot of work to do, so after the TL designs the current thing, they go off and start designing the next thing, and the next one, and eventually you have a buildup of design docs that haven't been implemented yet. Kanban says, this is useless; the design docs are inventory. Of course those designs will be at least partly obsolete by the time the eng team has time to implement them. Maybe goals will have changed by then and you won't implement that design at all. Meanwhile, the TL has sent around the doc for review, and there are meetings to talk about it, all of which distracts from actually finishing the work on the current feature which needs to get done.
Kanban, and JIT manufacturing, says the TL should go take a long lunch and recharge for when they're needed. Or better still, help out on the engineering phase, to push it along so that it will finish sooner. And that is, of course, the magic of Kanban. It plays some psychological games, using index cards, to convince TLs to write code and (further down the chain) engineers to help with testing, and reduce useless meetings, and stop maintaining code you don't yet need. It forces you to multitask less, which is a way of tricking you into prioritizing better.
We're engineers, so we're pretty smart. If we want, we could just, you know, dispense with the psychological games, and decide we're going to strictly prioritize and strictly limit multitasking. It takes some willpower, but it can be done. I happen to be terrible at it. I am the worst about multitasking and producing inventory. Way back at the beginning of this talk, when I showed a slide with our release goals slipping in 2016, yeah, that was us multitasking too much, which was partly my fault, and facilitated by having too much headcount.
What that means is, I know this is a lot harder than it sounds. It's actually really, really hard. It's one of the hardest things in all of engineering. Most people are very bad at it, and need constant reminders to stop multitasking and to work on the most important things. That's why these psychological games, like sprints (artificial deadlines) and index cards and kanban boards were invented. But if we want to become the best engineers we can be, we have to move beyond tricking ourselves and instead understand the underlying factors that make our processes work or not work.
That chart of the slipping release times was what reminded me to follow the rules I already knew: Prioritize. Limit multitasking.
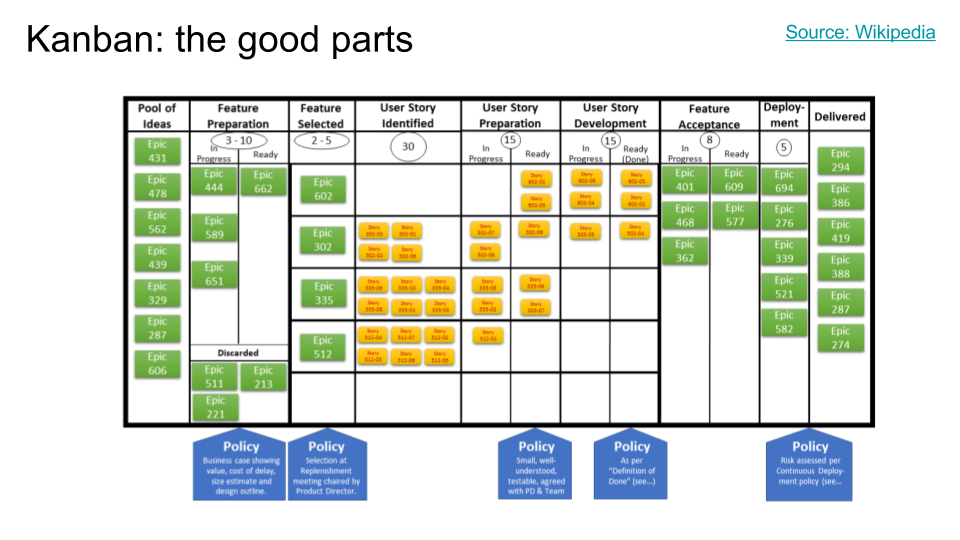 Here's a sample kanban-for-software board, from wikipedia. I just wanted to point out visually how the psychological game works. Basically, there is only a limited amount of space on the board. To advance a story from one phase (horizontally) to the next, there needs to be an empty space in the destination phase. If there isn't, then you must first move a job from that phase (by finishing it) to the phase after that. And if there are no holes there, then something needs to get pushed forward (by finishing it) even further down the line, and so on.
If your job is to work on a phase and there are no holes left for you to fill, then you literally have to stop work, or (if you're flexible), go help with one of the downstream phases. And we enforce that by just not having enough physical space to paste your index cards. It's kinda neat, as a mental trick, because the most primordial parts of your brain understand the idea that physical things take physical space and there's no physical space left to put them in.
[Random side note: Kanban-for-factories actually does things the other way around. They send an index card upstream to indicate that they need more stuff in order to continue work. This avoids the need for an actual "kanban board" that everyone all over the factory, plus your suppliers' factories, would need to all congregate at. Instead, you have these index cards flying all around, indicating when work needs to be done. (To limit multitasking, there's a carefully limited number of cards of each type.) On the software kanban board, you can think of the "holes" moving upstream and doing the job that the "cards" do when moving upstream in a factory. That, in turn, reminds me of how doped semiconductors carry signals around: you can have excess electrons moving around (n-type) or "holes" moving around (p-type). A hole is a missing electron, and it can carry information just as well as an electron can, although slightly slower, for reasons I don't remember. Many people are surprised to hear that p-type semiconductors don't involve moving protons around, just holes.]
 Time for another simulation, this time about multitasking. Our simulated SWE team is back, working just as hard as ever (and no harder), but this time we're going to extend the simulation past the first milestone. Furthermore, let's assume (perhaps too optimistically) that we have convinced our PMs to follow the advice in the previous slides, and they no longer change their minds in between milestones. The deal is this: once they set milestone goals, those are locked in, and the engineers will keep working until they're done. (This is like a sprint in Agile, except there is no strict deadline. We work until it's done, and different milestones might have different lengths.) However, PMs don't have to tell us what the next milestone contains until this one is done. They can change their minds day after day, and argue all they like, but only until the milestone starts. Then they have to start arguing about the next one. Got it? Great.
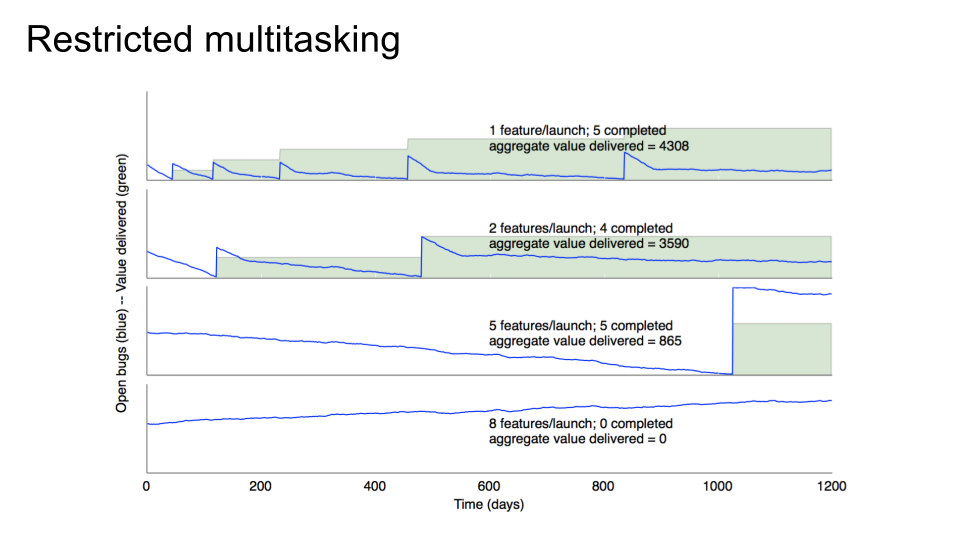
Another concept we need to cover is the idea of "aggregate value delivered." Remember that our simulation involves several features, and each feature contains a bunch of bugs/tasks, and each task can be in one or more features, and new tasks are being filed all the time. Because it's a simulation, we don't know how good these "features" really are, so let's assume they are all worth one unit of awesomeness. When we ship a feature, users don't get all the value from that feature right away; it accrues over the time they use the product. So the total value delivered to customers is a function of the number of awesomeness units that have launched, and how long ago they launched. In the charts, that's the green area under the curve. Of course, this is all very approximate, because it ignores features losing or gaining customers over time, the fact that some features have more value (and are harder to implement) than others, and so on. But the fundamental truths are the same.
Note also that new bugs/tasks are coming in all the time, across all features, whether launched or not. Once you've launched a feature, you still have to keep maintaining it forever. And no, not launching doesn't avoid that problem; the market keeps moving, and if you launch your feature a year later, the customers will have quietly become more demanding during that time. That's why in the simulation, new bugs keep getting filed in non-launched features, even if you're not working on those features yet. In the real world, those bugs wouldn't exist in any bug tracking system, but you'd sure find out about them when you go try to launch. So the simulation is assuming perfect knowledge of the future, which is not very realistic, but it's okay because you're not really acting on it. (Features you're not working on are accruing virtual bugs, but... you're not working on them, so they don't affect the simulation results until later, when you do work on them, in which case you would know about them in real life.)
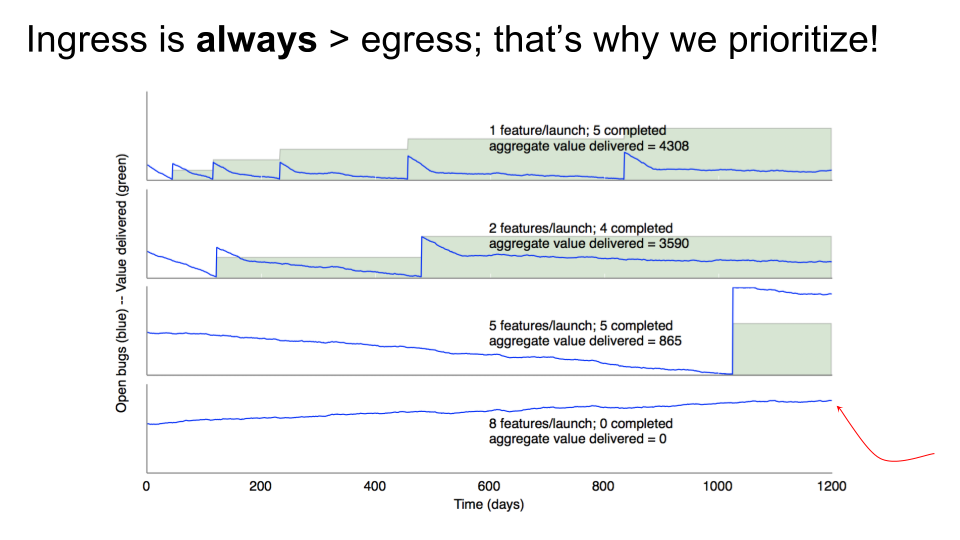
So anyway, there are four simulations here. The only difference between them is simply a variation in how many features we try to squeeze into each milestone. In other words, a measure of the amount of multitasking. In the first graph, we work on, and then launch, each feature one at a time. In the second, we do two at a time. Then five at a time, and eight at a time, respectively. The simulator then helpfully sums up the total green area in each case.
Notice that in, say, the top two charts, it takes about the same time to launch the first two features and then the next two features. (The slight variations are partly due to simulator jiggliness and partly due to some second-order effects we don't need to go into, but they're small enough to ignore.) In other words, the fourth feature ships at the same time in both cases. But because you ship the first and third and fifth features earlier in the first chart, the total accrued value is higher. That's kind of intuitive, right? If you ship a simple thing sooner, some users can start enjoying it right away. They won't enjoy it as much as the bigger, better thing you ship later, and some users won't enjoy it at all, but a few will still be accruing enjoyment, which hopefully translates into revenue for you, which is great.
Notice how each subsequent release takes longer. That's because you have to keep fixing bugs in the already-launched code even while you add the new stuff. That's pretty realistic, right? And once you've launched a bunch of things, you slow down so much that you're pretty much just maintaining the code forever. You can see that in the first chart after feature #5 ships: the burndown chart is basically just flat. At that point, you either need to fundamentally change something - can you make your code somehow require less maintenance? - or get a bigger team. That goes back to our headcount scalability slides from the beginning. Is your code paying for itself yet? That is, is more value being accrued than the cost of maintenance? If so, you can afford to invest more SWEs. If not, you have to cancel the project or figure out how to do it cheaper. Scaling up a money loser is the wrong choice.
The third chart is interesting. We launch five features before we start accruing any value at all. Remember, that's the same five features as in the first two charts, and we have perfect foreknowledge of all bugs/tasks that will be filed, so it's the exact same work. But look how much less aggregate value is delivered! About 4x less than chart #2, or about 5x less than chart #1. And the only thing we changed is how much we're multitasking.
The mathematicians among you might be thinking, okay, Avery, you're cheating here by cutting off the graph at 1200 days. What if we doubled it to 2400 days? Then the majority of the chart would have 5 features launched (recall that the team isn't able to scale beyond 5 features anyhow), and the relative difference between scores would be much less. So it's artificial, right? As time goes to infinity, there is no difference.
Mathematically, that's true. But it's like big-O notation in evaluating algorithms. When n goes to infinity, every O(n) algorithm is indistinguishable. But when n is a small finite number, then different O(n) algorithms are completely different, and sometimes an O(n) algorithm completely beats an O(log n) algorithm for small n. The schedule is like that. Your software won't be accruing all that value forever. Competitors will release something, customers will move on. You have a limited window to extract value from your existing features, usually only a few years. By releasing features later, you are throwing away part of that window.
And of course there's chart #4, where we simply never launch at all, because there are too many features with too many integration points and the team just can't handle it; every time they fix one thing, another thing breaks. I don't want to name particular projects, but I have certainly seen this happen lots of times.
So, can you really get a 5x revenue improvement just by reducing multitasking? Well, I don't know. Maybe that's way too high in the real world. But how about 2x? I think I'm willing to claim 2x. And I know I can do infinitely better than chart #4.
...by the way, none of these simulated SWEs were doing any kind of simulated Kanban with simulated index cards and simulated boards with holes. We just had an informal agreement with PMs about how many features they were going to try to launch at a time (where a feature is, say, a story or a set of stories; we'll get to that soon). Kanban is just a psychological game to enforce that agreement. But if the engineers and PMs trust each other, you don't need all that fluff.
 Now that we've seen the simulations, we can go back to Painless Software Schedules to emphasize one of the points Joel makes a big deal about: you can't negotiate about how fast people will work. Engineers work at different rates at different times, but it really isn't very variable. Remember those surprisingly straight downward slopes in the simulations? It's just as surprising in real life projects - I'll get to that in a bit. But that straight line makes a clear statement: that yes, I really can extrapolate to predict how long it will take to finish a particular set of tasks, and no, I really cannot do it faster and I probably will not do it slower, either. End of story, conversation over.
Once we know that - and burndown charts are quite good at convincing people that it's true - then we can have the real conversation, which is, what things actually need to go into the release and which things don't? Once we know the work rate - the slope of that line - we can move the requirements around to hit whatever date we want. We want to do this as early as possible of course, because late requirements changes are expensive, as we saw in the simulator. But since we do know the work rate, we can predict the completion date immediately, which means it's possible to have those discussions really early, rather than as we approach the deadline.
Suddenly, the manager and the engineers are on equal footing. The manager is a trained negotiator and can fire you, but the engineers have empirical truth on their side: this is not a matter of opinion, and the facts are not going to change. Better still, the engineers mostly don't care too much what order they do the features in (within reason). So the manager or PM, who is now making the scheduling decisions, doesn't need to negotiate with engineers. They can negotiate with sales or marketing or bizdev teams or whoever, who have actual feature requirements and date requirements, and agree on a combination of features and dates that is physically possible in the real world.
And then, crucially, they will not tell those dates to the engineering team. The engineering team doesn't need to know. That would be setting a goal, and goals are bad. The engineers just do the work in priority order, and don't multitask too much, and let statistics handle things. No student syndrome, no Whatever Conference rush, no working weekends, no burnout, and no lazy days needed to recover from burnout.
It sounds too good to be true, but this actually works. It's math. Coming up, we have a bunch of slides where I continue to try to convince you that it's just math and real life matches the simulation.
...but first, it's time to finally start talking about stories and story points.
(Most ideas from this section are blatantly stolen from Estimating Like and Adult.)
I'm going to be honest, I find the way "stories" are done in Agile to be kinda juvenile and faintly embarrassing. You make up these fake "personas" that have names, and pets, and jobs, and feelings, and you describe how they're going to go about their day until they bump into some problem, which your software is then going to solve. But it doesn't yet, of course, because the story isn't true yet, it's fiction, that's what makes it a story, and your job as an engineer is to make the persona's dreams come true.
I'm sorry, I tried to remove the snark from that paragraph, but I just couldn't do it. I think this format, with realistic people and feelings and such, is extremely useful while PMs discuss designs with UX designers (who think about character archetypes) and UX researchers (who tell literal stories about literal people who tried to use the product or mocks of the product). No problem there. That's not juvenile, that's empathy, and it's essential to good UX. I don't know exactly how they do things at Apple, but there's no way they aren't writing excruciatingly detailed stories about their users' product interactions.
But eventually the stories need to get explained to stereotypically un-empathetic software engineers, who often got into this business because they wanted to have a job that mostly did not involve empathizing. Not all of them, but many of them. And let's be honest, the engineer working on a new feature for Gmail's backend probably just doesn't need to know all those personal details. "User will be able to search for emails by keyword, and the results will be returned in no more than 2000ms, and results will be ranked by relevance" is fine, thanks, and gets to the point a lot faster.
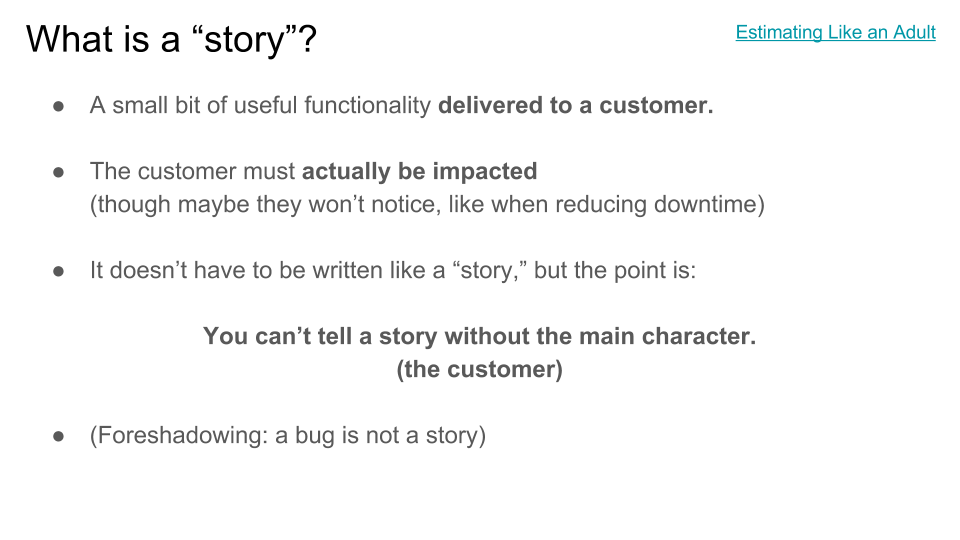
But here's the reason Agile pushes those stories so hard. Stories are, by necessity, about a person who does something. That person is always the customer. We don't write stories about what the backend engineer does (which is how we often write bugs/tasks, and that's fine). We write stories about what the customer does. That's absolutely essential. At the level of abstraction we're talking about - features that will deliver value, like in our simulation - only things that affect the customer are allowed, because things that don't affect the customer do not deliver value to the customer.
There are lots of things engineers have to do, in order to deliver value, that do not themselves deliver value to the customer. You might have to do 10 of those to deliver value. Well, in that case, you have 10 bugs (or tasks), making up one story (feature). That's fine; that's what we did in the simulator, too. Engineers were fixing bugs for days and days before a feature was done enough to launch.
For the following discussion, that's what you need to know. Stories don't have to be written like a story, but they have to truly reflect something the user will benefit from. None of this works otherwise.
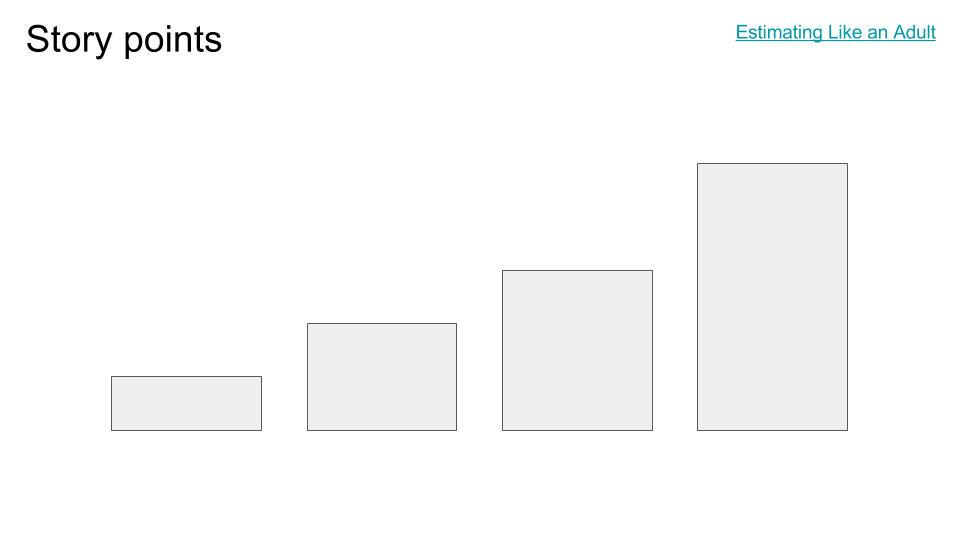 Agile doesn't just talk about stories, though, they talk about story points. Story points are an absolute breakthrough in project estimation; I might make fun of any other part of Agile (and sometimes I do), but this part is genius. You can tell it's genius because it sounds so trivial, and yet fixes numerous problems that you probably didn't even know you had. But don't worry, of course I'm going to tell you all about those problems.
In my talk, I popped up this slide on the big screen and asked people to do an experiment with me. I didn't know for sure if it would work, but it ended up working out even better than I had hoped. I asked a simple question: "How tall is the third rectangle from the left?"
One person immediately piped up, "Three!" "Ok, three what?" I asked. "Units." "What units? Tell me the height in, say, centimeters." And now people had a problem. "Can we just measure it?" someone asked. "The size depends on what screen you display it on," said another. On my laptop screen, it was maybe 4cm tall; on the projector, maybe 2 feet. "How tall would it be for, say, a typical L5 screen that Meets Expectations?"
It was surprising how quickly people understood this point for estimating rectangles, although it's somehow harder to understand for estimating tasks. Estimating absolute sizes is really tough. Estimating relative sizes is almost magically easy. Now, there was someone in the audience who thought it looked more like 4 units than 3, a disagreement which was actually excellent for multiple reasons, as we'll see in the next slide.
But before we go to the next slide, I want to say more about the problems of estimating tasks using absolute sizes. Don't experienced engineers get pretty good at estimating how long tasks will take? Let's say I'm going to write a basic Android app, and I've done a couple of basic Android apps before. Is this one easier or harder? How much harder? 2x, 3x? Okay, let's say it took 3 months to launch the last one, and this is 2x harder. Then say 6 months, right?
Well. Maybe. First of all, from when did we start counting? Conception, design, first day writing code? And hold on, are you going to hold me to that 6 month estimate? Maybe I should add a safety factor just in case. Let's say 8 or 9 months. But even worse, now we've set a goal, another one of those evil, productivity destroying goals. I have a project that I'm pretty sure will take 6 months, but maybe it's not as hard as I thought, and anyway I said 8 months, so I can relax for the first two at least. Maybe more if I'm willing to rush near the end, because I kinda remember rushing near the end of the last one. Student syndrome returns. And now we can guarantee it won't take less than the 8 month estimate, but it will almost certainly take longer, even though it was only a 6 month project. And that's why the more experienced a person gets, the longer their estimates get.
What happened here? We let the engineer know the due date. Never do that.
People have all these weird hangups about goals and about time. Story points have the astonishing ability to just bypass all that. Nobody sets a "goal" that the project will take 5 points to complete. What does that even mean? It's a five point story, it will always take 5 points to complete, no matter how long that turns out to be. It is 5 points, by definition. What are we arguing about?
With story points, there is no late, and there is no early. There's just how long it takes. Which we can measure surprisingly accurately, because story point estimates turn out to be surprisingly accurate. We just have to cheat by not telling the engineers the date we estimated, because when we do, their brains go haywire.
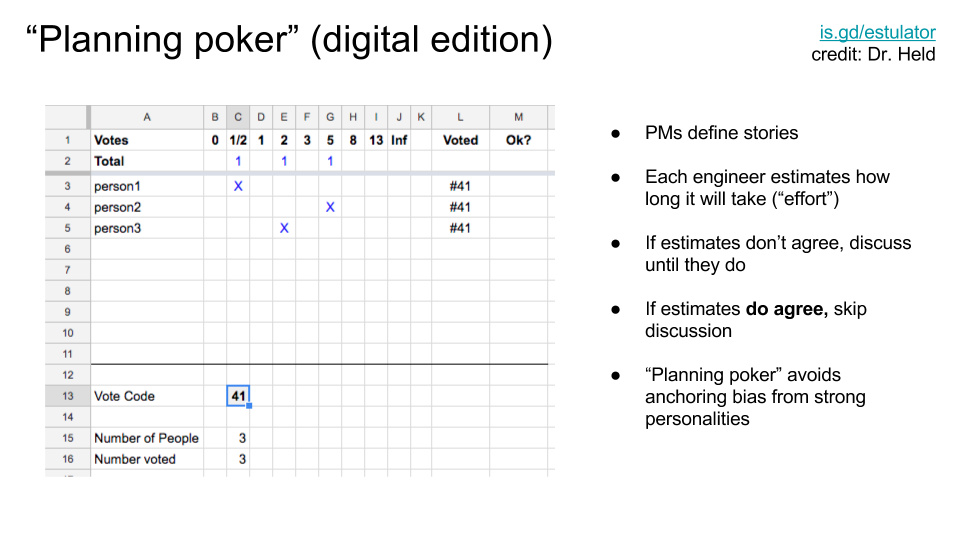 In the talk, we had this useful disagreement about whether the rectangle was really 3 or 4 units high, which was excellent for showing the next step: the actual process of coming to an estimate. For this, we steal a concept taught in an excellent corporate project planning class (not sure if it's still taught), called Planning Poker. In turn, he apparently stole it from some variants of Agile or Scrum.
Now, the method he teaches involves a physical deck of cards with numbers printed on them in a pseudo-fibonacci sequence. (You know this must be at least a fairly common game if you can buy these cards, which you can.) But playing cards are a pain for people in remote offices, because you have to do silly things like trying to squint at cards over a videoconference, etc. So my co-worker, Dr. Held, created a little spreadsheet version of the game which works pretty well.
You start by loading is.gd/estulator and making a copy of the spreadsheet for your team. Then you delete all the per-user tabs, and add one for each person on your team. Then you add those users' names in the first column of the Results tab.
For each round of voting, you set the Vote Code field to a new number. (You can just increment it, or use whatever formula you want. The only important thing is that it isn't the same as the last round of voting.) Then, each user opens their own tab in the spreadsheet on their own laptop, and enters the vote. Only once all users have voted (with the right vote code) are the votes revealed on the Results page.
Now, it's actually very important that you don't bias people by discussing the number of points before the vote; you want their honest answers. We screwed that up in this exercise, because we'd already talked a lot about whether the box was size 3 or 4. But oh well, we also had troublemakers who intentionally voted differently, so it worked out this time for the demo. (We still saw the results of bias: as soon as the votes were revealed, a bunch of people rushed to change their answers to make them agree with the consensus. Don't do that!)
Note that the "3 vs 4" discussion was moot anyway, because of the "pseudo-fibonacci sequence" rule. You can't vote for 4, because it's too close to 3. You have to choose 3 or 5. The lucky disagreement about 3 or 4 was a really convenient way to show why the fibonacci sequence is useful for cutting down on needless precision.
So anyway, people all vote and then you see their results. If not everyone agrees, then the tradition is that you ask one of the people with the highest vote (the one who has spoken least recently), what they think is necessary in order to do the task. Then you ask one of the people with the lowest vote. Then, you discuss more if needed, or else go immediately to a revote, and you repeat until you all agree. As a shortcut, if the votes are split between two consecutive values, you can just pick the higher one of the two. (Mathematically it turns out not to matter what the rule is for dealing with split votes, as long as you're consistent. If you bias on the high side or the low side, the formula for converting points to time, ie the velocity, will just compensate. If you bias inconsistently, you'll get increased variability and thus an increased error margin.)
The really interesting thing about this method is that nobody has any particularly vested interest in a particular story being a particular number of points. After all, nobody knows the size of a point anyway, and nobody is setting a deadline or making promises of a completion date. So there's no reason to argue. Instead of fighting to be right about the exact size, people can instead focus on why two people have such a widely varying (at least two fibonacci slots) difference of opinion. When that happens, usually it's because there's missing information about the scope of the story, and that kind of missing information is what really screws up your estimates if you don't resolve it. The ensuing discussion often uncovers some very important misunderstanding (or unstated assumptions) in the story itself, which you can fix before voting again.
Another neat feature of the voting game is that you don't spend time discussing stories where everyone agrees on the size. Maybe not everyone understands every detail of the story right now, but they apparently understand well enough to estimate the size (and maybe they disagree on various details, but apparently those details don't affect the size much). So just accept the story size, and move on.
This combination of features makes it a great way to spend your weekly or biweekly team meeting:
-
You talk about things that definitely matter to customers
-
The person who has spoken least recently gets to talk, which reduces various social biases
-
You don't talk about stuff that everyone already knows about
-
You end the meeting early if you've gone through all the stories.
There are lots of ways to estimate story points, but you might want to give this one a try.
 Okay, so now you have a
bunch of stories and their sizes, in points. How do you track those stories
and their progress? This is where I sell you a tool, right?
Okay, so now you have a
bunch of stories and their sizes, in points. How do you track those stories
and their progress? This is where I sell you a tool, right?
Nope! We still don't need a special tool for this. The thing about stories is that they're pretty big - it takes quite a while to deliver a unit of useful functionality to a user. At least days, maybe weeks or even months. The size of a story depends on how your team wants to do things. But don't make them unnecessarily small; it doesn't help much with accuracy, and it makes the estimation a lot more work. You want estimation to be so quick and easy that you end up estimating a lot of tasks that never get scheduled - because when the PM realizes how much work they are, they realize there's something more effective to be working on.
Note that this is a departure from the Joel on Software method, where he recommends estimating line items of no more than 4 hours each. Those aren't stories, though (his method mostly pre-dates Agile and stories), those are bugs (tasks). We'll get to those later. Stories are way bigger than 4 hours, and that's perfectly fine.
Since stories are so big, that means we don't have very many of them. Since we don't have very many of them, they are easy to keep track of using any method you want. Agile people use paper index cards, and they don't get overwhelmed. The course I took recommends just keeping a spreadsheet. That works for me.
The spreadsheet is just a bunch of rows that list the stories and their estimates, but most importantly, the sequence you're planning to do them in. I suggest working on no more than one at a time, if at all possible. Since each one, when implemented, is made up of a bunch of individual tasks (bugs), it is probably possible to share the work across several engineers. That's how you limit multitasking, like kanban says to do. If your team is really big or your stories are small, you'll have to work on several stories at a time. But try not to.
Note also what the spreadsheet does not need to contain:
-
Estimates of how much time has already been spent working on each story
-
Estimates of how much time is remaining
-
Pointers to which bugs are in the story
-
Expected completion date of the story
You don't need that stuff. This spreadsheet is for the PMs and executives to write down what they want, and in what order. The engineers estimate the relative effort each of those things will take. Then the PMs re-sequence those things to their heart's delight, except for the first unfinished one, because it's too inefficient to change the goals mid-milestone (as we saw in the simulation slides earlier).
But you still need status updates, right? Everyone loves status updates. How will we track status updates in a mere spreadsheet, without endless tedium and overhead?
We'll get to that. Hang on.
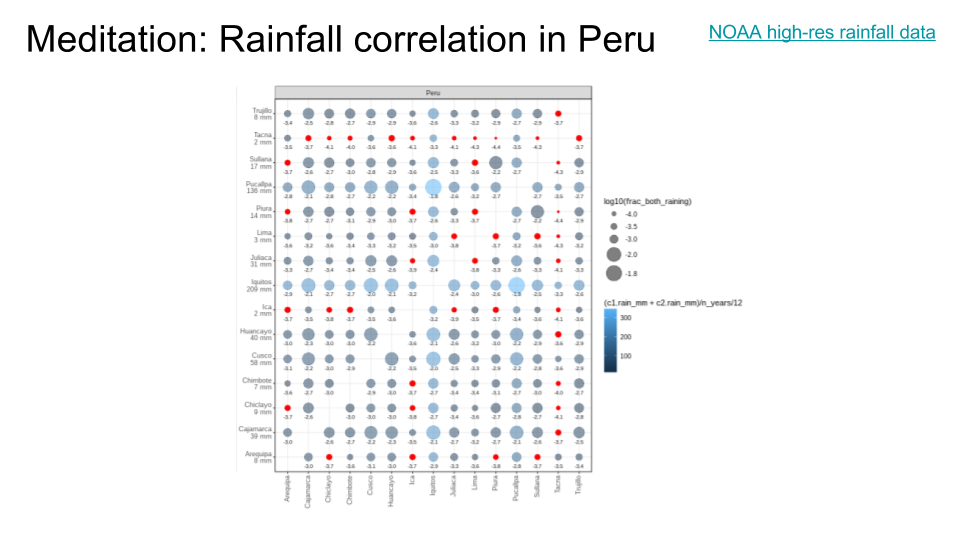 That was a lot of serious story estimation business, and this was the spot where we had a designated bathroom break, so I included this meditation slide where I correlated the rainfall in various sites in Peru as part of some random analytics for a team I was working with. I thought it was neat.
Also, the NOAA keeps data sets for the rainfall amount in every 8km x 8km region, between 60N and 60S latitude, every 30 minutes, going back decades. Impressive!
Better bug (or task) tracking
 We've spent a lot of time
talking about Agile, and Kanban, and Joel, and Stories, but now we have to
diverge from all of them. We're going to steal another trick from that
project management course I took: we're going to fundamentally break our planning
into two completely different layers of abstraction.
We've spent a lot of time
talking about Agile, and Kanban, and Joel, and Stories, but now we have to
diverge from all of them. We're going to steal another trick from that
project management course I took: we're going to fundamentally break our planning
into two completely different layers of abstraction.
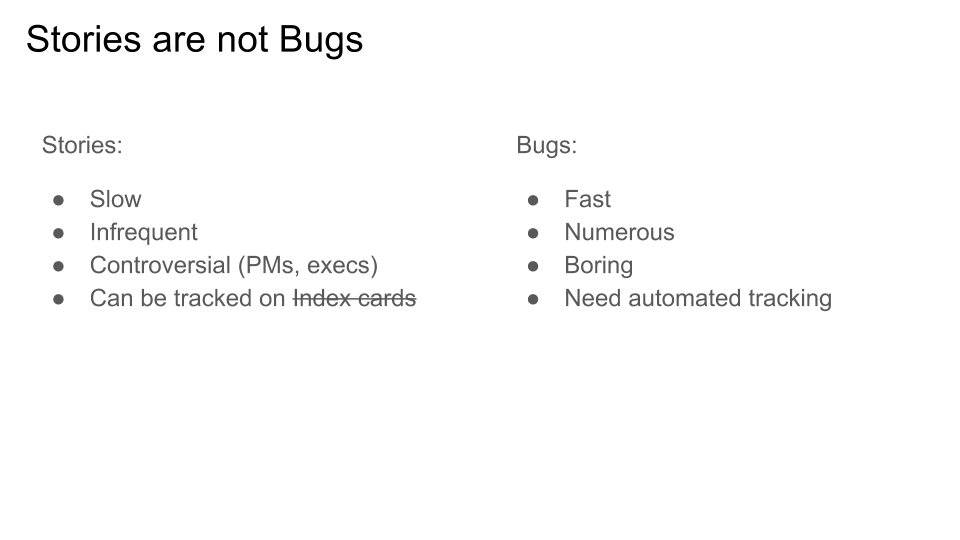
The course called these, I think, Business Tasks (or maybe Business Goals) and Engineering Tasks, but those are too hard to pronounce, so let's call them Stories and Bugs.
Agile mostly deals with stories (big). Joel mostly deals with bugs (small). The big innovation in the project management course I took is that we want to do both at once. We'll make stories that are a bit bigger than the stories usually used in Agile (but maybe not as big as an "Epic"), and then we'll split each of them into numerous bugs, on about the scale Joel uses for his individual tasks.
The nicest thing about this split is it allows for a clean division of labour. PMs come up with stories; engineers estimate them; PMs sequence them; engineers then work on them in order, ideally only one at a time. On the other hand, PMs don't care at all about bugs. Only engineers care about bugs, and do them in whatever order they want, with whatever level of multitasking they think is appropriate. Engineers can just avoid attending the story sequencing meetings, and PMs can avoid attending the bug processing meetings. It really cuts coordination overhead a lot.
However, one place where we'll depart from the course I took is in handling bugs. They recommended using a spreadsheet and Planning Poker (with different point scales) for both stories and bugs. I'm going to recommend against estimating bugs at all (see next slide). I also think for bugs, you can skip using a spreadsheet and file them straight in the bug tracker. In applying the method from the course I took, I found there was a lot of tedium in keeping things synced with a bug tracker, which comes down to a common software engineering problem: if you have a bug database and a spreadsheet, then you have two sources of truth, and synchronization between them is a lot of work and tends to break down. Just use the bug tracker. For that we're going to have to use bug trackers effectively, which we'll get to a bit later.
I really like this simplification, because it makes bug fixing a first class activity. That's different from most Agile methods, which tend to treat bugs as overhead (you need to do it, but it's not accomplishing a new story, so we don't really track it and thus don't reward it). Lots of teams use bug trackers a lot, so we need a method that works with what they already do.
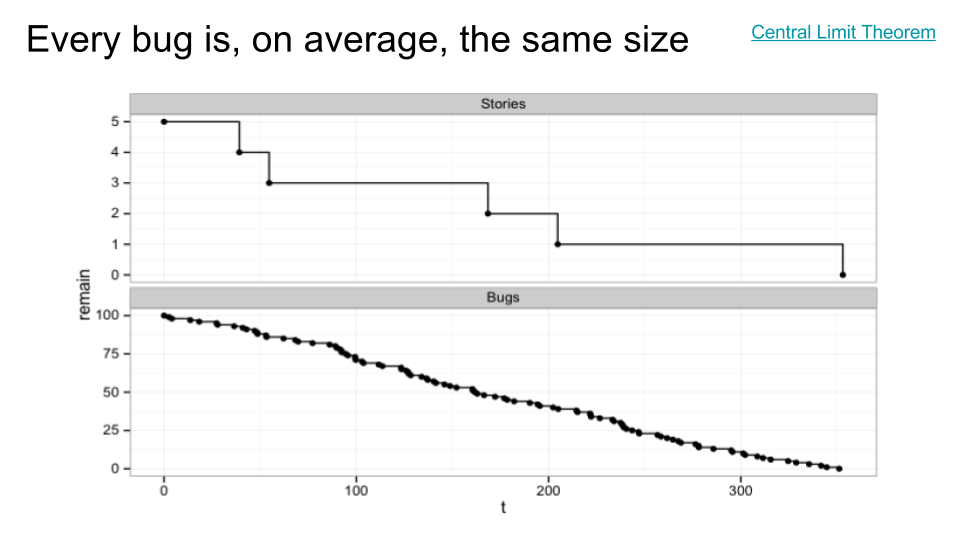 To explain why estimating bugs is unnecessary, I first need to convince you that all bugs are effectively the same size. For that, I made yet another simulation. This one is very simple. First (in the top chart), I created 5 stories, and gave them sizes between 1 and 13 points. If we finish them in sequence with no multitasking, we burn down from 5 stories to 4, 3, 2, 1, 0 over time. As you can see, the top line is very erratic. If you tried to estimate story completion dates by drawing a straight line from (0, 5) to (350, 0), you'd be pretty far off, most of the time.
On the other hand, the second chart has a bunch of bugs, distributed between 0.1 days and 10 days in length (with shorter times being more common; essentially a Poisson distribution). That's a range of 2 orders of magnitude, or 100x duration difference from the shortest bug to the longest. Pretty huge, right? The top chart was only one order of magnitude; much less variable.
And yet, the bottom chart is more or less a straight line. Like the top chart, it assumes no multitasking; that is, there is only a single engineer working on exactly one bug at a time, and sometimes it takes them 10 days, but sometimes they get lucky with a stream of 0.1-day bugs. But it doesn't matter! There are so many bugs that it just all averages out. If you draw a straight line from beginning to end, you're only off by a few days at any given point in the sequence. That's way too small to matter. If you add in multiple engineers on a team, the variations get even less, because even while one poor sucker works on the 10-day bug, the rest of the team keeps making progress on 0.5, 1, and 2 day bugs. [Random side note: this is also why restaurants with at least two bathroom stalls are a good idea.]
Why does that happen? The underlying reason is the Central Limit Theorem (linked above), which says that if you sum enough samples from nearly any random distribution, it ends up converging on the normal (Gaussian) distribution. A Gaussian distribution has a mean and a standard deviation. The more samples you sum together, the smaller the standard deviation is as a fraction of the average. Which is a long-winded way of saying if you have a lot of bugs, they are all about the same size. Or close enough not to matter.
You might not believe me, because this is a simulation. Good. Let's (finally!) look at some real patterns from some real projects.
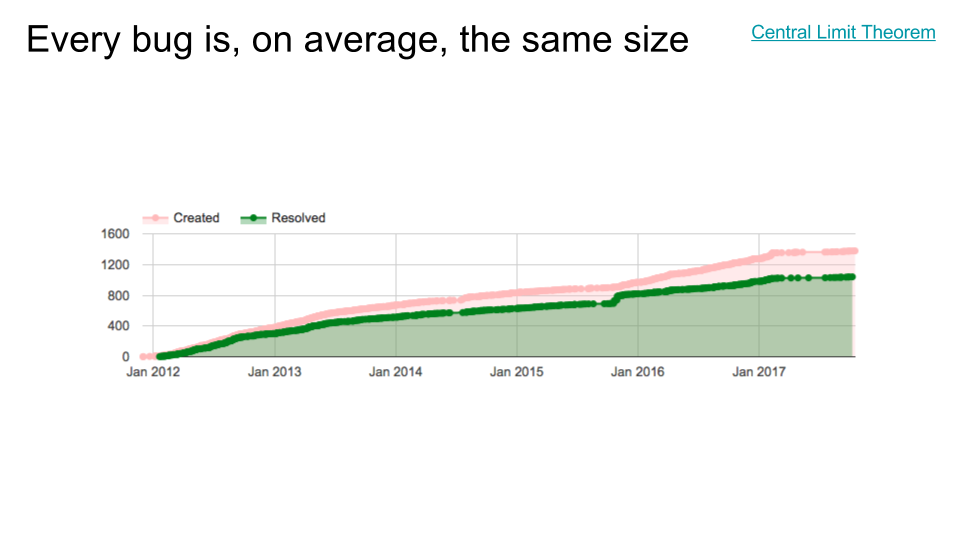 Here's one from my old team's project bug tracker. Note that we're not just looking at one or two stories here; this is literally the whole component. I'm showing the burnup chart here instead of the burndown chart because for this particular team, it makes some characteristics a little more obvious. (In a burnup chart, the red dots correspond to new bugs being added, and green dots correspond to bugs being fixed. The difference between them would be a burndown chart.)
First of all, notice the distinct phases. We launched in late 2012; leading up to that, we were in heavy dogfood, so bugs were getting furiously filed and fixed. After launch, interestingly, bugs started getting filed a little more slowly (perhaps the most serious flaws had finally been resolved, which is why we launched) and fixed more slowly still, resulting in an increasing deviation between the two lines. (This corresponds to more and more bugs outstanding. In and of itself, that's pretty normal; most launched projects find that their user base is finding bugs faster than the engineers can fix them.)
In late 2015 there was a declared bug bankruptcy (long story). I have some choice words about bug bankruptcies but I'll save them for another slide. The main thing to notice is that the bankruptcy improved neither the filing nor the fixing rate. It caused a one-time bump in fixed bugs (a lying bump, of course, since they weren't really fixed, just forgotten). But the lines' slopes stayed the same.
Finally, we reorged the project in early 2017 and moved things elsewhere, which meant a lot fewer bugs in this component got fixed (nobody to fix them) but also a lot fewer got filed (nobody to file them). By mid-2017, a new team took over, and you can see bugs getting filed and fixed again, but at a much lower rate than before.
Cool story, right? But here's what you need to notice. Look how straight those lines are. There are defined segments corresponding to major events (launch; reorg; recovery). But for literally years at a time, the bug filing/fixing rates are remarkably stable. Just like in the simulations.
 Here's another team I've
been working with, that shall remain nameless. This chart is a little
different: instead of a whole bug tracker project, this tracks only the
particular milestone (hotlist) they were working on, starting in late July
2017. As you can see from the y axis labels, we're now talking about an
order of magnitude fewer bugs, so you'd expect more variability.
Here's another team I've
been working with, that shall remain nameless. This chart is a little
different: instead of a whole bug tracker project, this tracks only the
particular milestone (hotlist) they were working on, starting in late July
2017. As you can see from the y axis labels, we're now talking about an
order of magnitude fewer bugs, so you'd expect more variability.
The milestone was being worked on in July and finalized around August 4th. It includes all bugs that were still open as of August 4th, as long as they were relevant to the particular set of stories included in this milestone. The bugs could have been filed at any time back in the past (in this case, as far back as late 2014). Somewhat confusingly, bugs which were relevant to this milestone, but which were already fixed by triage time, were probably not added to the milestone. That's probably why you see this weird behaviour where the creation rate increases at first, before it stabilizes into a straight line. Notice that they explicitly stopped adding bugs to the milestone (ie. froze the requirements) around mid-to-late August. That's why the "Created" dots stop at that time, while the Resolved line continues to increase. However, it's pretty clear from the slopes of the two lines that even if they had continued to add new bugs at the same rate, they would have converged eventually. Story-relevant bugs were being found slower than fixed, which is what you need if you ever intend to launch.
Once again, look how straight those lines are. When the milestone was under construction during July, the work rate was already higher than it had been, but once it was fully committed in August, the engineers got right to work and productivity increased dramatically. You can clearly see the before, during, and after segments of the chart.
The most important observation is this: the engineers were, most likely, all working at about the same rate before the milestone goals were decided. (They were fixing a lot of bugs that don't show up in this filter: creating inventory.) But once everyone focused on the agreed-upon priority, performance on the highest priority items more than doubled. Just eyeballing it, maybe even 3x or 4x.
Well-defined strict priorities, communicated to everyone, can get you to launch 2x-4x faster than just letting engineers work on whatever seemed important at the time.
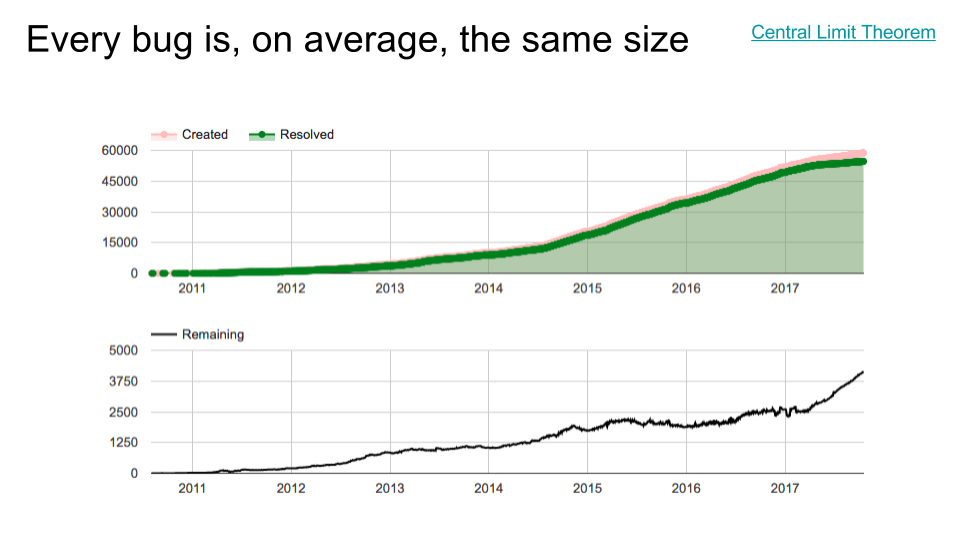 One more very artificial query: the entire internal bug tracker for a huge corporate project.
Again, even though we don't even really know what the project is, aren't the patterns interesting? It's pretty clear that the lines are, again, surprisingly straight, except for some major transitions. I'm guessing something launched around late 2012, and something else changed in mid-to-late 2014. Then something disastrous happened in early 2017, because the number of remaining open bugs (bottom chart) started shooting up out of control, with no end in sight. Observe also, though, that at the same time, the bug creation rate slowed a little (and even more over time), while the bug fixing rate slowed much more. To me, this sounds like a team being destaffed while a project is still in heavy use - a dangerous strategy at the best of times, and a recipe for angry customers.
But oh well. Even here, the key observation is that for very long stretches, other than transitions at major milestones (launch, another launch, destaffing), the lines are again surprisingly straight. I wouldn't feel too guilty taking a ruler and extrapolating a straight line to make a rough time estimate for how long something might take to finish, at any point in that chart. In fact, even after destaffing, the Remaining line is still straight. It'll never finish, because it's upward instead of downward, but it's straight and therefore predictable.
[Random side note: check out the scale on the top graph. They were handling about 15000 internally-facing bugs per year! Handling dogfood feedback for a popular project can be a nightmare. But it also gives us a clue that the reliability is probably not high enough.]
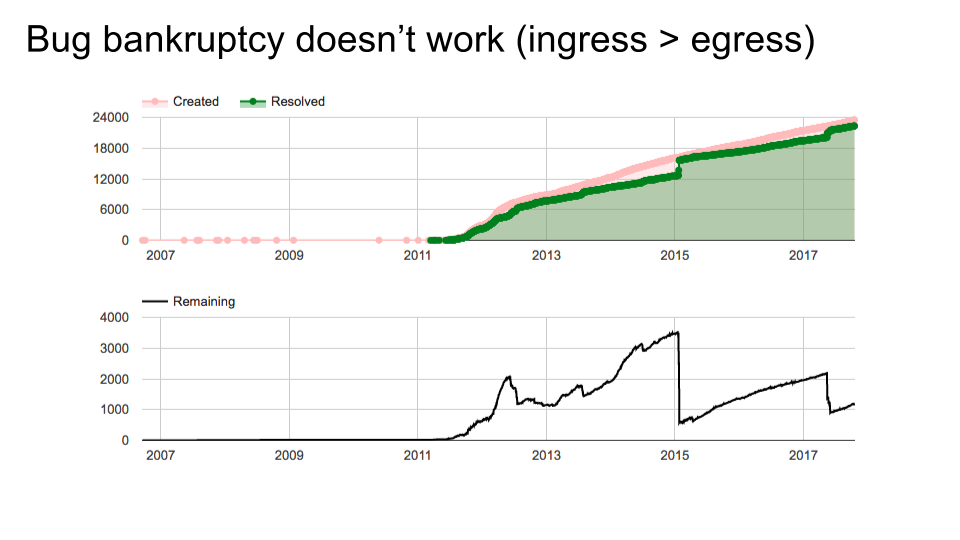 One more chart, for another project that shall remain nameless. This team did at least two bug bankruptcies (possibly another in 2012, though maybe it was just a manual re-triage since the slope isn't as steep). The problem is, once again, that the slopes of the lines didn't change.
Teams that find themselves under a seemingly endless deluge of bugs certainly have a problem: the ingress rate of their bug queue is faster than their egress rate. That will certainly cause an ever-increasing pile to build up. If your project is popular and understaffed, that's unavoidable. (Recall our simulation earlier of trying to continually launch features with the same team: after a while, you just can't make progress anymore because you're stuck maintaining all the old stuff.)
Unfortunately, some of those teams think they can improve their situation by correcting the absolute value of the number of open bugs. This doesn't work; if you can't improve the slope of the line, then a bug bankruptcy is at best a temporary fix. You might as well not be filing the bugs in the first place.
Look again at the previous slide. That team was handling 15000 bugs per year, and the number of bugs remaining open, while it fluctuated a bit, was neither increasing nor decreasing. Impressively, they had the deluge under control. So, we have evidence that it is, in fact, possible to keep your head above water. The team on this slide (and my own old team, three slides ago) was constantly falling behind, unfortunately. They're pretty normal; the more popular your project is, the more likely you are to experience it. But bankruptcy helped not at all. They need a real solution.
Let's use this as the motivator for the next section of my talk: bug triage. In other words, dealing with the inevitability that you can't fix bugs as fast as they get found.
 But first, here's my simulation again. Remember chart #4? When they had all 8 features going at once, the open bug count just kept going up instead of down. I bet that team felt doomed. They could have declared bankruptcy, but that wouldn't have helped either.
The first three charts give us a clue. The same exact team, working on the same product, was able to not get into the ever-rising-tide situation. How? By strictly prioritizing, and by controlling the level of multitasking. The trick is that the first three plots don't show the count of all bugs outstanding: they just show the count of bugs related to the project's current priorities.
That's how we deal with the deluge situation: we only count the bugs that really matter. Which leaves only the question of how we decide which ones matter. That's triage.
 Before I try to give some tips for bug triage, I want to go back to psychology and talk a bit about what does and doesn't work well in a bug tracker.
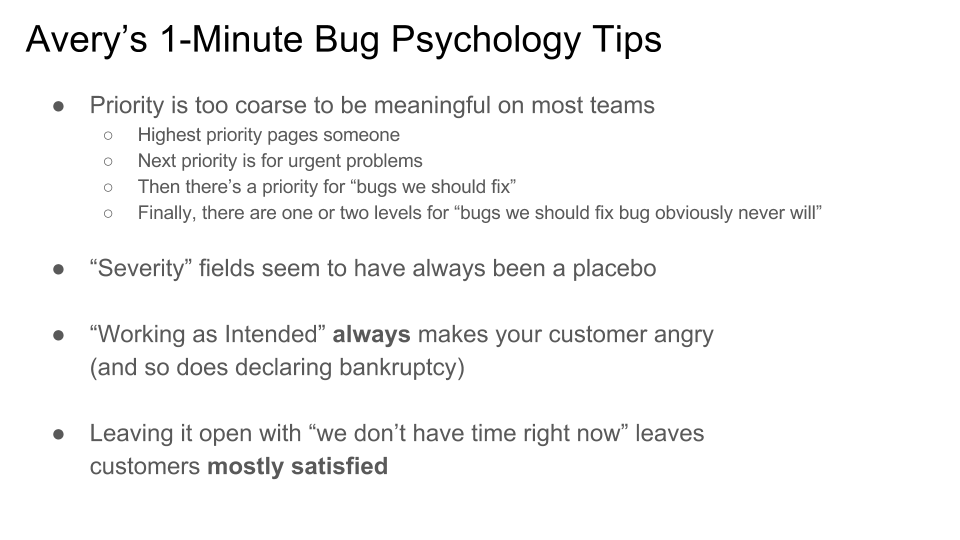
First of all, in my corner of the world, priority levels have been made almost completely meaningless by well-intentioned teams. Depending on the project, P0 often ends up paging someone, which is rarely what you want, so you usually don't use P0. P1 often has a stupid bot attached, which pings the bug if you stop responding, trying to enforce some kind of short SLO, so the pattern is often that you file a bug, then someone looks at it for a while, makes little progress, gets annoyed by the bot, and lowers the priority to P2, only to be interrupted by the next round of new P1 bugs. It maximizes distraction without necessarily getting more bugs resolved. Oops! P2 is the default, which is fine, but of course, almost all bugs are P2 so your bug pile is undifferentiated. And at this point everyone knows that P3 and P4 both mean "will never implement." I don't know why we need two separate levels for that, but okay, that's how it is.
Some people complain about the tyranny of bug priority schemes chosen by other teams, and how they shouldn't affect my team because we want to use something less silly, but that doesn't work. Everyone has been trained that when they file a bug, those are the levels. Trying to be different will just confuse your users, because they can't keep track of every team's special snowflake policy.
"Severity," a field available in some bug tracking tools, is even weirder. I've never found anyone who can explain what it's actually for. I know what it supposedly means: there are definitions about how many end users it's affecting, and how badly. Like, if there's a typo in the menu bar of a major app, that's definitely S0 because it affects a lot of people and it's super embarrassing. Whereas a crash that affects 10 users out of a billion is maybe S4. Okay, sure. But nobody ever sorts by severity; they sort by priority. Those could just as easily have been P0 and P4. What is a P4 bug with an S0 severity? A placebo. It made someone feel good because there is a field for "yes, this bug is actually important!" and another person decided "but not important enough to work on." Maybe this method works, but I don't know for who. Anyway, I advise just ignoring severity fields.
More psychology: resolving as "Working as Intended" (the infamous "WAI") always just makes your customer angry. So does mass-resolving bugs as obsolete without looking at them. But pro tip: setting them to P3 or P4 does not create this effect. It's a useful mystery. It means the same thing, but customers are happier. Might as well do it. Instead of a bug bankruptcy, let's call it a bug refinancing.
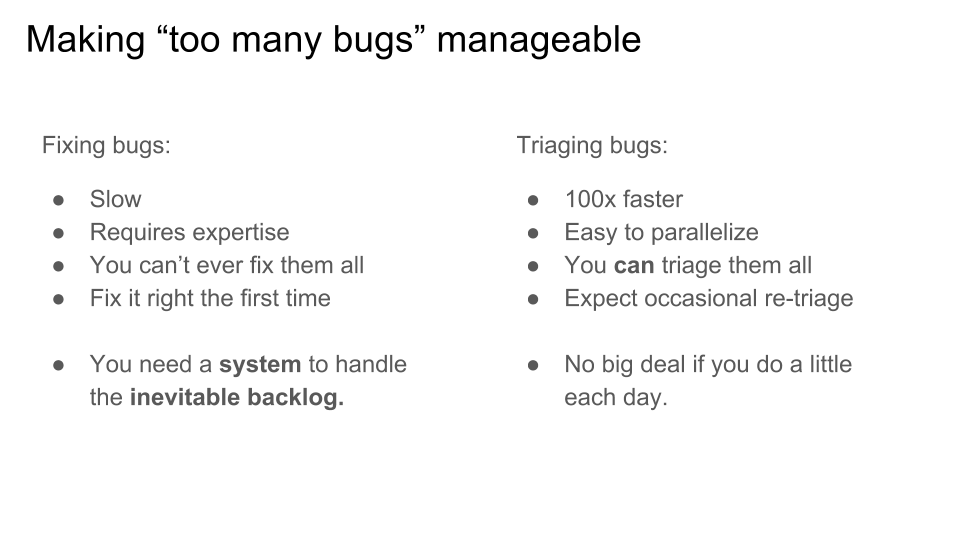 Of course, that advice about leaving more bugs open, and all of them at P2, and ignoring the severity, leaves you with a giant undifferentiated ever-growing mass of bugs. That's no good. On the other hand, that's nothing new; if you're like one of those popular teams on the other slides, you were going to end up with that anyway, because your ingress rate is simply greater than your egress rate, no matter what. We need a system to deal with this.
Step one is understanding the triage step. It's totally different from the fixing step, for all the reasons listed in the slide.
Many teams try to take every incoming bug and make sure it's assigned to someone on the team, under the assumption that the person will reassign it or fix it eventually. Of course, that doesn't work when ingress > egress; each person's queue will be ever-growing, not ever-shrinking, and eventually the Assignee field also loses all meaning, and you have an even bigger problem. That's not what triage is. That's just giving everything high priority, which as we all know, means nothing is high priority. (Incidentally, that's the mistake we made on my old team: skipping triage and just assigning every bug to someone. I had to ask around a lot to find out that successful teams were all using a triage method that actually works!)
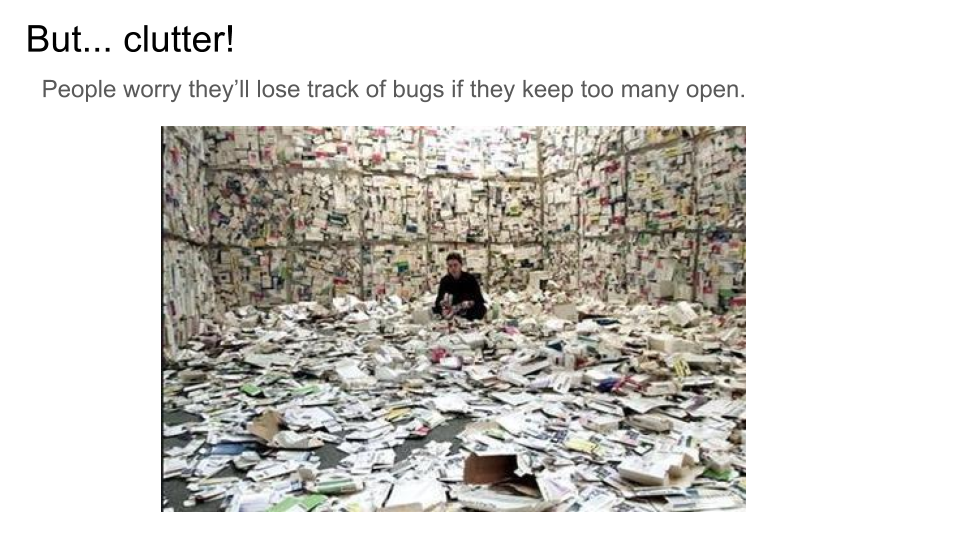 Okay Avery, so now you're saying don't assign the bugs to people, don't close them, set them all to average priority, and ignore severity, all while accepting that the pile will be ever-growing? This is not sustainable.
[This slide is a visual representation of unsustainable clutter. I started with an image search for "overrun by bugs" and quickly learned my lesson. Don't do that.]
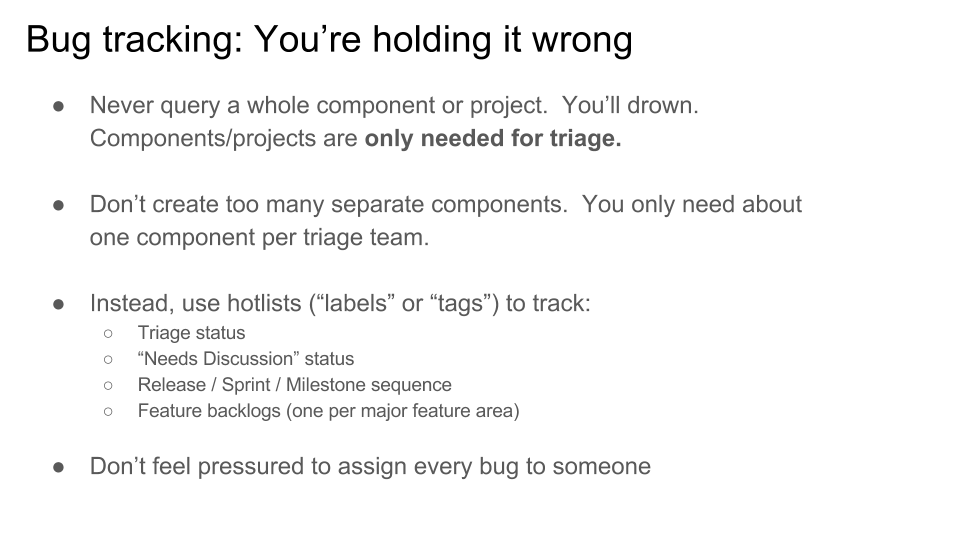
Step one: never just look at an entire project-wide bug tracker. It's like looking at every file on your filesystem, or every web site indexed by a search engine. Beyond a certain size, it just doesn't work anymore. Your project is almost certainly at that size. Bug trackers have queries. It's time to learn how to use them to solve your problem.
Second, a huge surprise that I didn't realize until I started asking around to the teams that were using bug trackers effectively. Bug tracker "components" (aka dividing by "project" or "area") are almost useless! They are only good for one thing: helping your end users point your bug at the right triage team. Each triage team triages one or more components. Each component is triaged by exactly one triage team. If you only have one triage team, there's no real reason to have a dozen sub-components, no matter how much sense that seems to make, because it will just confuse your end users (they won't know which component to use when filing a new bug).
Instead, use hotlists (aka "milestones" or "labels" or "tags" depending what bug tracker you use). Your triage team can figure out what a bug is about and how important it is. Their main job it so assign it to the right label(s), then move on to the next one. Once it's in a milestone or label, you no longer care what component it's in, because the eng teams working on features are working on a strictly-prioritized set of stories (remember!) and the stories are defined by one of those milestones. And the high priority labels are not depressingly ever-increasing in size.
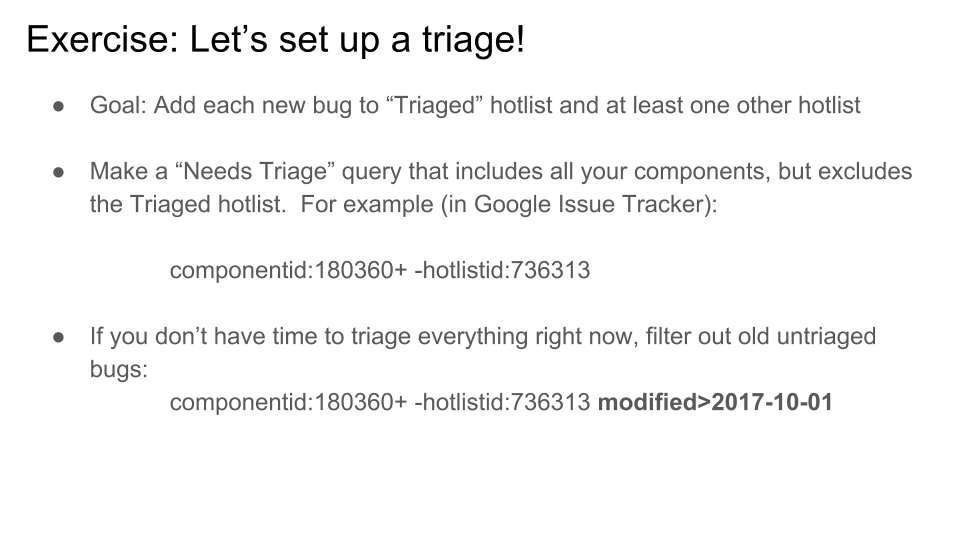 [To give some concrete
examples, I'm going to use Google Issue Tracker (issuetracker.google.com), which is
not very popular, but happens to be something I use a lot. In Issue
Tracker, you can create and view "hotlists" (aka "labels", specific lists of
bugs that you have tagged) and "saved searches" (search queries that you
have named and saved for later use, which update their contents as bugs
change). Every bug tracker has something like these two features, if you
explore around. But the syntax of these specific example queries is from
Google Issue Tracker.]
[To give some concrete
examples, I'm going to use Google Issue Tracker (issuetracker.google.com), which is
not very popular, but happens to be something I use a lot. In Issue
Tracker, you can create and view "hotlists" (aka "labels", specific lists of
bugs that you have tagged) and "saved searches" (search queries that you
have named and saved for later use, which update their contents as bugs
change). Every bug tracker has something like these two features, if you
explore around. But the syntax of these specific example queries is from
Google Issue Tracker.]
Now all you need is a way to tell the triage team which bugs they haven't yet triaged. That's easy enough: make a bug query for "everything in my interesting set of components" but subtract "everything in my hotlist called ‘Triaged'". I call this query "Needs Triage."
Then the triage team, for each bug, will: - Assign the bug to at least one hotlist (either a release milestone, aka story, or a backlog of not-yet-scheduled features; maybe it's even relevant to more than one feature hotlist) - Assign the bug to the Triaged hotlist to make it disappear from their queue.
That's it! No need to assign it to anyone - the eng team pulling from a given hotlist can do that.
If you have a giant bug tracker that already has a lot of bugs, and you want to get started using this method, add a "modified>DATE" query filter. That will make it so that only bugs edited after the given date are subject to triage. But any old bug, if someone pings it, will immediately make it appear, so that you can triage it right away. Much better than declaring bankruptcy!
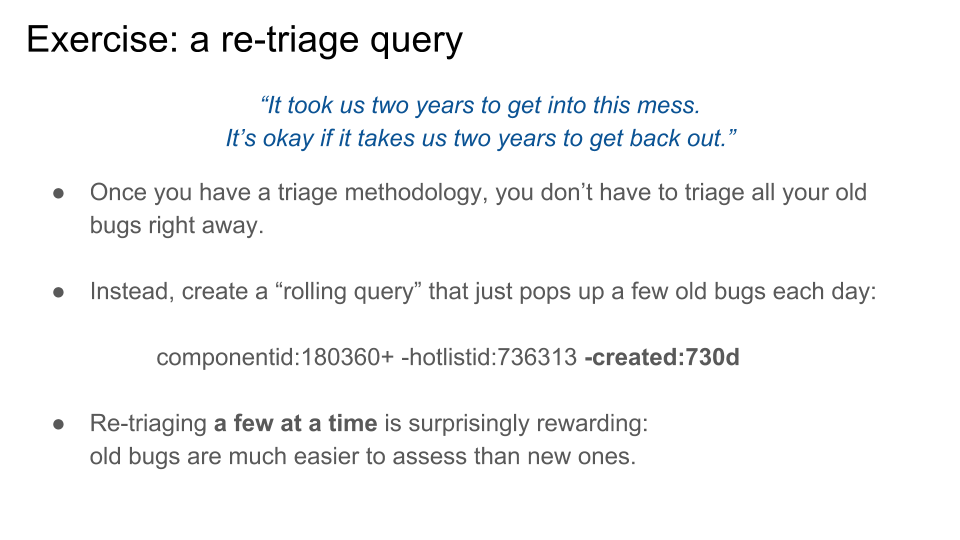 If you have a huge backlog and are thinking of declaring bankruptcy, another trick is to make a separate query that again looks at all the bugs in all your interested components, and subtracts out everything in the Triaged list. But this one, instead of having a modified>DATE absolute cutoff, uses a relative cutoff date. In this example I picked 730 days, or two years. What this means is that any bug created more than two years ago, but untriaged, will show up in the query, inviting you to triage it now. Over the course of the next two years, this moving window will slowly pass over all your remaining bugs. (If you have more than two years of backlog, increase the date accordingly. It'll take longer to go over the whole set, but then again, you already had super old bugs, so this won't make it any worse!)
Most people faced with triaging a huge bug backlog just give up. Argh, thousands of bugs? It's just too frustrating. Kill them all with fire (bug bankruptcy). This re-triage query is disproportionately much more pleasant than trying to triage them all in a burst or an ad-hoc series of bursts. If you can triage all your new incoming bugs - and I assure you that you can, using this method, because triaging bugs is way easier than fixing bugs - then you can also re-triage your old bugs. After all, the rate of ingress of bugs two years ago was almost certainly <= the rate of ingress today. Plus, you've already closed a lot of the old bugs from that time, and you'll only see the remaining ones. Plus, many old bugs will be obviously obsolete and can be politely closed right away. (My own experience, and experience of at least one other person I talked to, is that the rate tends to be roughly half the bugs are obsolete vs. still important. I've heard some people estimate 90% obsolete, but I haven't seen that be true in practice. Even if it were, closing bugs as obsolete is easy, and losing the remaining 10% of real bugs is pretty bad.)
If you're like me, you might find that the re-triage window actually moves a little too slowly, and you have extra capacity to re-triage more bugs on some days, between meetings or whatever. If so, you can just edit the query to reduce the 730d to a smaller number, a bit at a time. Then it'll take even less than two years to go through them all.
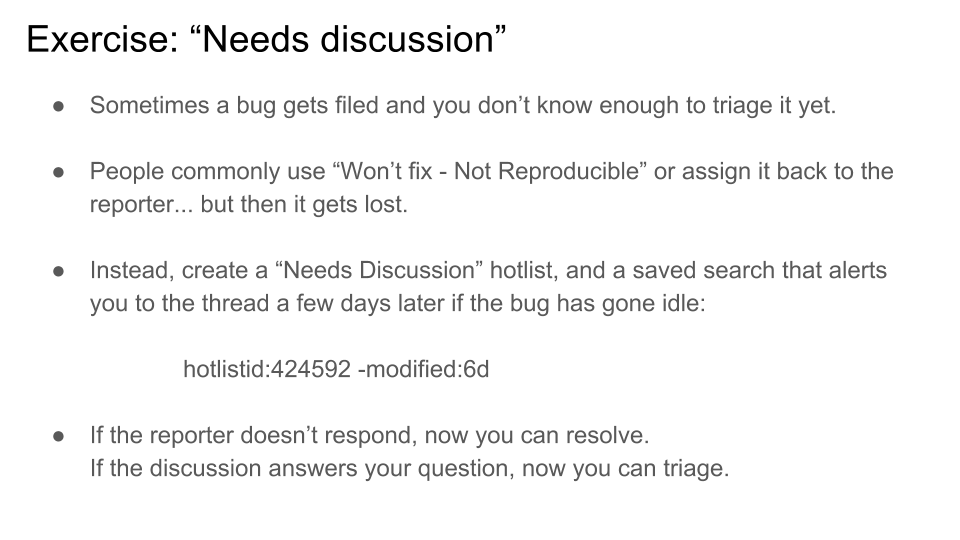 One more tip: sometimes when triaging, you need more information. People often make one of two mistakes when this happens:
- They resolve the bug as "not reproducible", which makes the bug filer angry (even if you ask them to reopen it when they've added better information) or
- They send the bug back to the reporter for more information, without triaging it. If you have no triage hotlist, and the original reporter never responds, or worse, they respond but forget to send it back to you, you now have an undead bug floating around in your bug tracker with no way to discover and rescue it. Or, if you do use the Triage hotlist and Needs Triage queries, you have the annoying behaviour that it will keep showing up in your triage queue until the customer responds - which may be never.
The solution is the "Needs Discussion" hotlist. When an untriaged bug needs more discussion before it can be adequately triaged, add it to this hotlist and assign it back to the sender. Change your "Needs Triage" query to exclude everything in the "Needs Discussion" hotlist. But now, add a "Needs Discussion (stalled") query with the magic "-modified:6d" filter shown above. What that does is it makes the bug disappear from your queries for 6 days, or as long as people are still communicating on the bug. Once it goes idle for 6 days, it reappears, at which time you can a) remember to continue the discussion; or b) close the bug Not Reproducible, because the person who filed it is non-responsive, and they have lost the right to be angry; or c) if you have all the information you need, finally triage it.
You can use a shorter time than 6 days if you prefer. Longer is probably a bad idea.
[Side note: it would be really nice if bug trackers had some kind of "discussion" flow feature that could track whose job it is to respond. Ideally we could just wake up right away when it's our team's turn again, rather than using the hardcoded delay.]
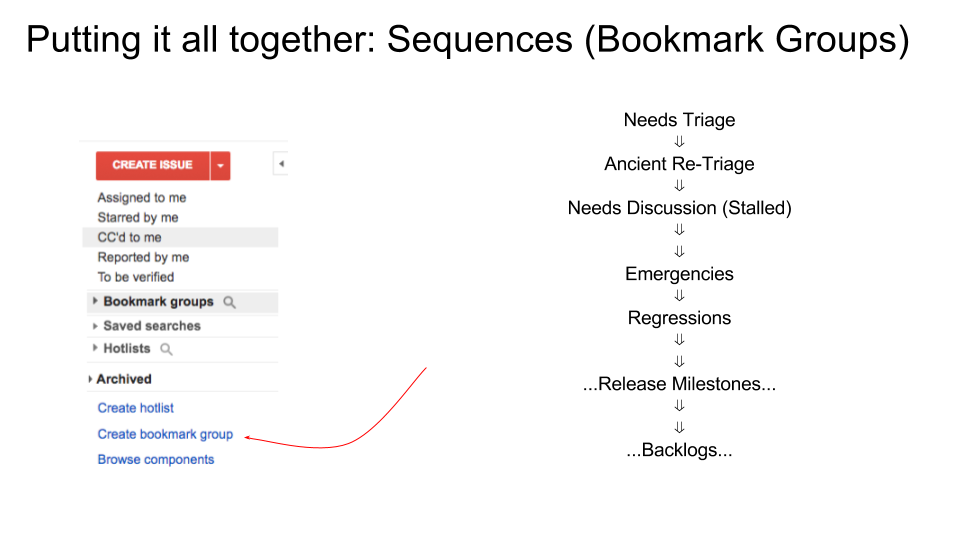 In the last few slides, we've made all these hotlists and queries. Now we have to put them all together. For this, you want to use your bug tracker's "dashboard" or "bookmark groups" features, which (to generalize) are generally just ordered sequences of hotlists and queries. I recommend the overall order shown above.
"...Release Milestones..." are hotlists representing stories you have scheduled for upcoming releases. "...Backlogs..." are hotlists representing stories or bugs you haven't scheduled for any release yet (and in some cases, probably never will).
 Congratulations, you made it to the end! If you thought it took a long time to read all this, just imagine how long it took me to write. Phew.
Why would you follow me on twitter? Use RSS.