
2016-12-31 »
Guess I might as well get in on the Leap Second Smear posts. Here's the ntp adjustment levels (in microseconds) across GFiber devices over the last couple of days.
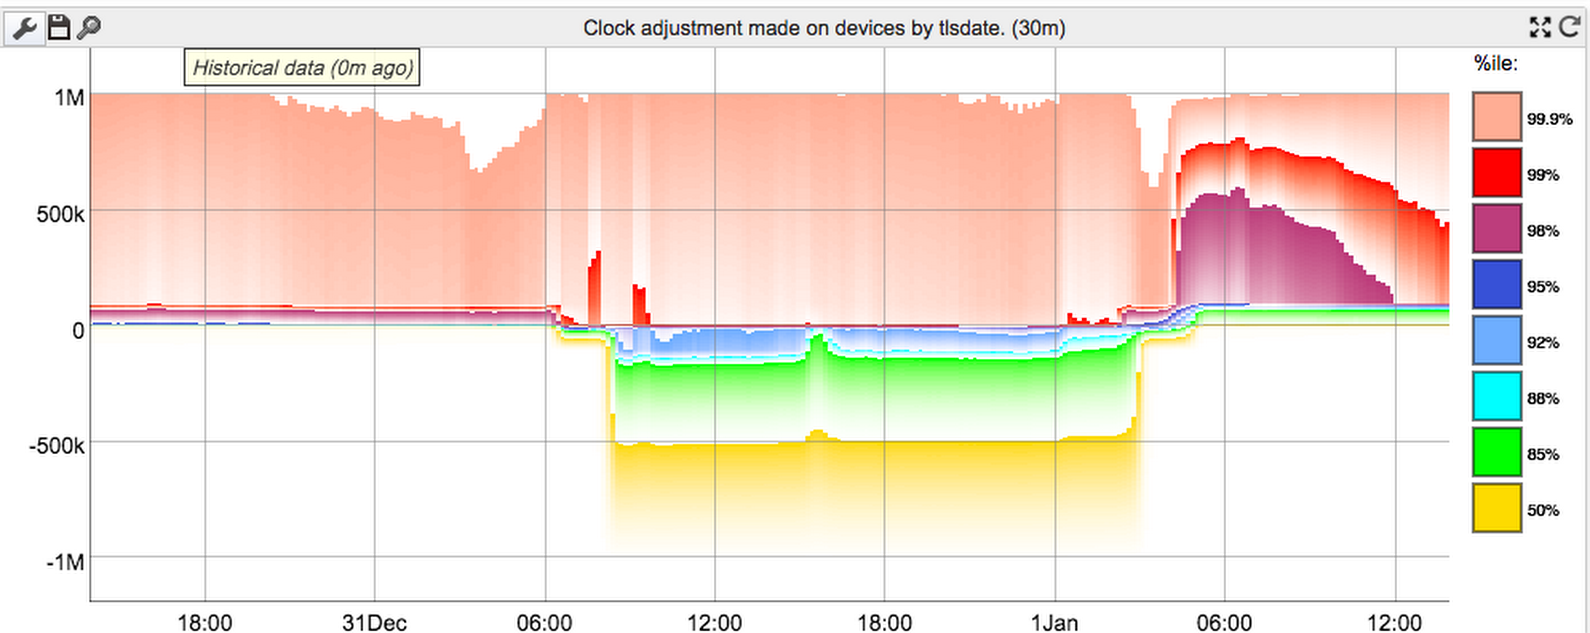
It probably deserves a little explanation. Under normal circumstances (ie the left side of the graph), devices have generally low (single-digit milliseconds) absolute error, except during initial boot, when they run tlsdate to get a rough sync. Unfortunately tls rounds down to the next-lowest integer second, so the first ntp sync after boot will typically (ignoring network latency) have between +0 and +1000ms of adjustment on top of the tls date. Since there's always a low-level number of devices rebooting for whatever reason, the upper percentiles are (almost) always around 1000ms. We really should filter out those early syncs, since they're completely misleading about the overall precision of our clock sync during real use. (Even the lower percentiles are probably dominated by these giant boot time errors.)
At some point, the Google ntp servers started smearing in the leap second. We use djb clockspeed, which spends a lot of effort trying to get the right clock rate and does a good job at it, so our actual refresh rate for hitting the ntp servers is quite low (it can be several hours between polls). Unfortunately, leap second smearing is precisely designed to screw up the clock speed, which is the worst case scenario for djb clockspeed, especially with infrequent polling. That means different devices can end up quite heavily diverged (in the +ve direction) from the server's time, if they don't check the ntp server for quite a while after the smear starts. Thus, the correction factor goes negative for a while (middle section). We still don't sync very often (idea: maybe start syncing more frequently when the measured error is higher?), so we then eventually get into overshoot, which is the rightmost section of the graph.
After that it seems to settle down quite rapidly - maybe too rapidly. I can't really explain why it works so well. I expected a bit of "ringing" around zero for a while. But maybe any given device rings a bit, but it averages out rapidly, so the percentile graph loses that granularity.
Why would you follow me on twitter? Use RSS.