
2014-06-15 »
Having some trouble understanding how the Shannon Limit applies to modern wifi and especially, but not only, MIMO.
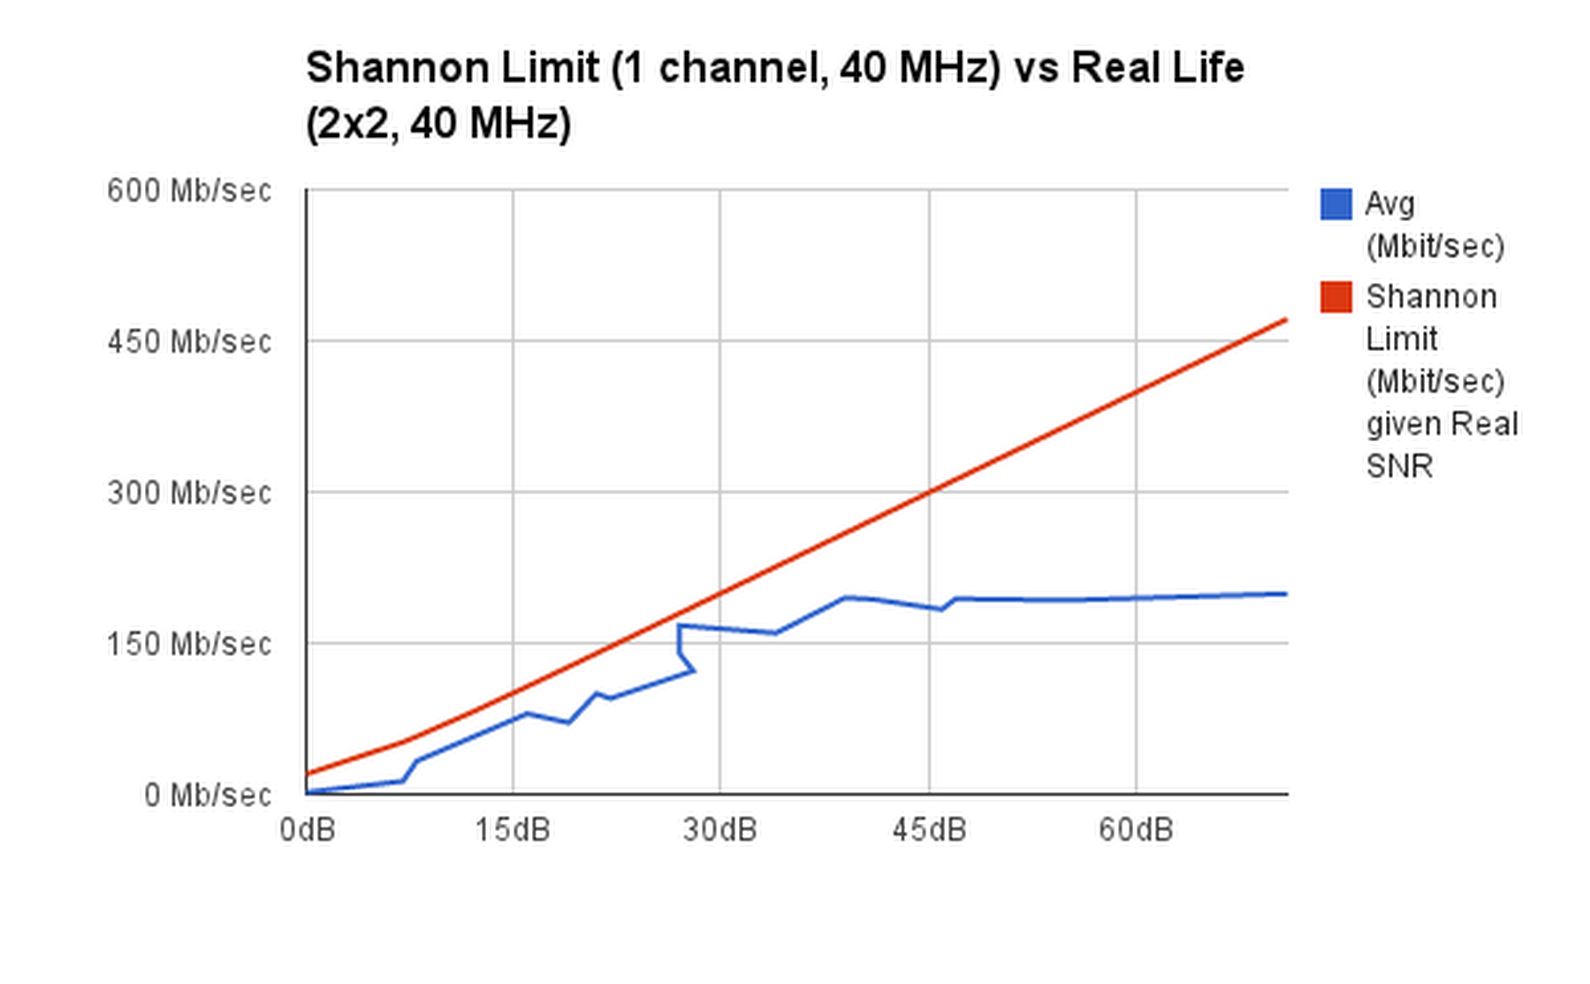
Here's a chart of my measurements of actual TCP throughput achieved at various distances between wifi client and access point. That's the blue line. The x axis is the signal to noise ratio. The line seems to be more or less straight (as predicted by theory) until the signal strength gets so high that 802.11n doesn't have a coding type that takes advantage of it, so it can't go any faster, and it flattens out.
The red line is the Shannon Limit, which defines the maximum capacity of a channel: http://en.wikipedia.org/wiki/Channel_capacity#Example_application
I used an example from here: http://www.ka9q.net/xmax_wifi.html to confirm my formula is not completely wrong. At 17.3 dB, it gives about 54 Mb/sec as expected for a 20 MHz channel. I'm using a 40 MHz channel with 802.11n, so I doubled all the values, and that's what you see here as the red line. (Trivia: the Shannon Limit is bandwidth*log(1+SNR), but note that it's the baseband bandwidth that seems to matter, and that's only half the modulated bandwidth. So you multiply by 10 for a 20 MHz channel, or 20 for a 40 MHz channel.)
As you can see (and as I confirmed more carefully), the red line has about the same slope as the blue line, other than the flattening out part. It's a bit higher, indicating that we don't quite hit the Shannon Limit (which is the theoretical maximum) but it seems pretty reasonable.
All good, right? Except... I didn't multiply by two for 2x2 MIMO. From what I've read, 2x2 MIMO should approximately double the limit, because you can treat it as two channels, and each channel has the same original Shannon Limit. When I multiply the red line by two, it of course looks completely wrong.
Moreover, you can't see it from this graph, but my original data tells me that for the blue line, all the values < 20 dB give up on 2x2 MIMO and switch down to SISO (1x1) modulations. I would expect to drop in half at that point, but as you can see, it doesn't. It just continues exactly the same linear progression. (Notably, in my actual table of MCS rates, it switches from a lower-rate 2x2 encoding (MCS11 -> 8+3) to a higher-rate 1x1 encoding (MCS4). So it's able to actually get more bits per channel when it uses fewer channels.
So okay, I'd even be willing to accept that 2x2 MIMO doesn't exceed the Shannon Limit as advertised, at least not indoors in an echo-ey environment with highly nonoptimal antenna placement. But then what should I expect from 3x3? I don't have an easily portable 3x3 MIMO client (I really should upgrade my laptop I guess). But if I multiplied the blue line by 1.5, it would exceed the red line. So we're back either to MIMO being able to exceed the Shannon Limit, or to having to multiply the red line (by 3 now I guess) in which case it's unreasonably huge compared to the real throughput.
What am I missing?
(Hmm. I wonder if a 3x3 MIMO client would not actually get much better results in the sloped section, but would simply un-flatten part of the flat section. If so, that would lend credence to my growing theory that in a room with lots of reflections, ie. imperfect non-orthogonal signals, MIMO has little to do with beating the Shannon Limit and more to do with dealing effectively with your own reflections.)
Why would you follow me on twitter? Use RSS.