Everything here is my opinion. I do not speak for your employer.
2013-03-30 »
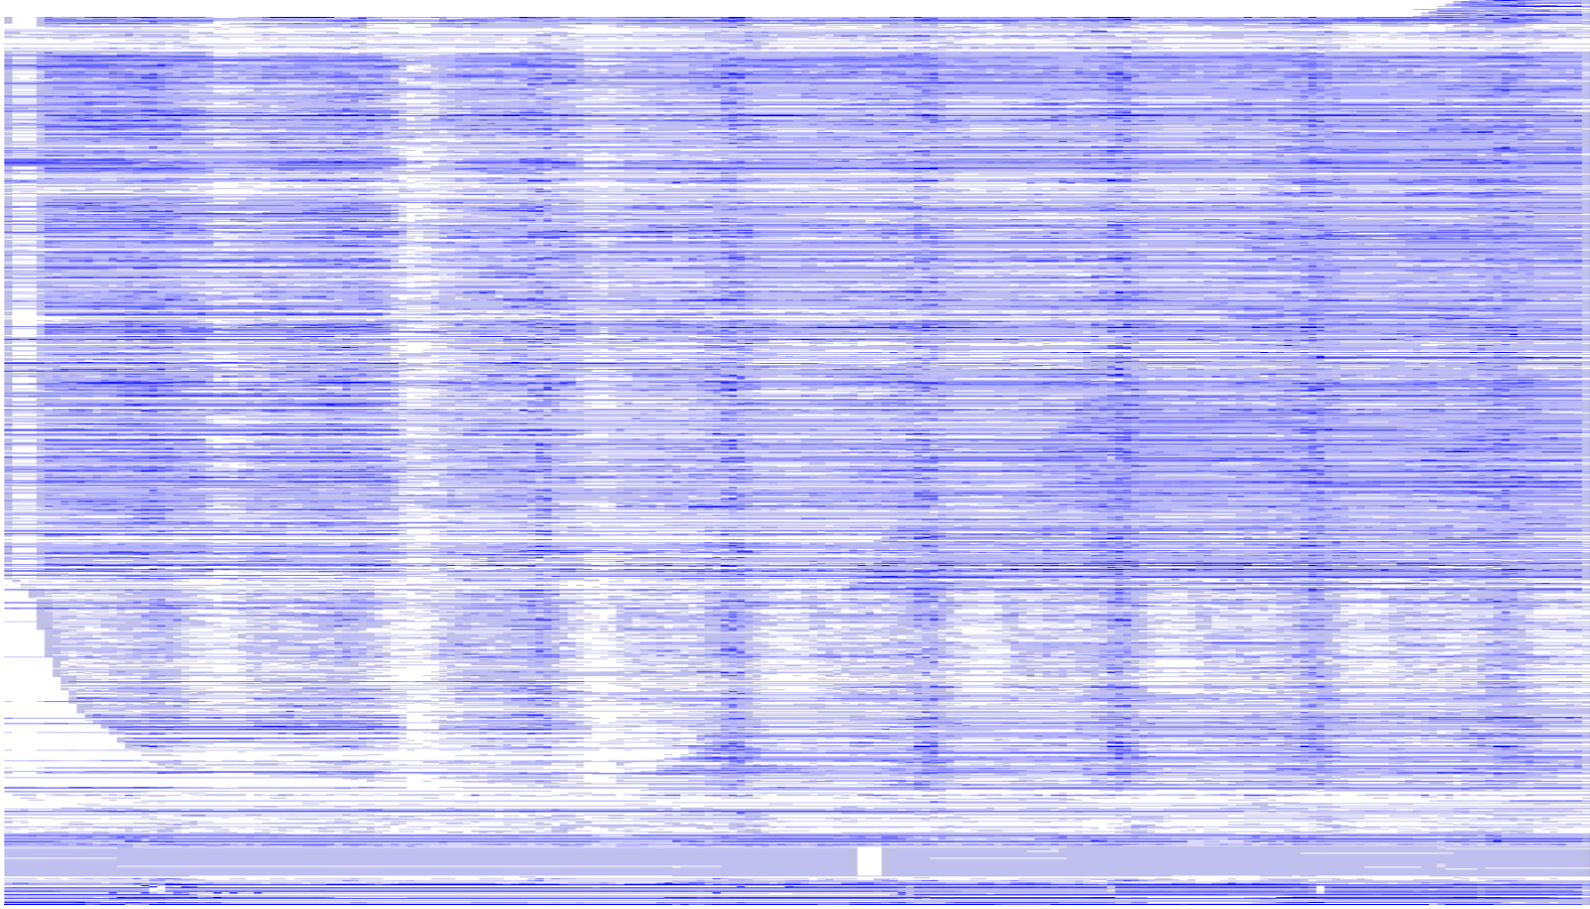
Friday's project:
The y axis has one pixel per device, sorted by a few interesting attributes. The X axis has one line segment for each one-hour period over the last week. The darkness of each resulting dot/rectangle corresponds to how much activity was done by that device during that time.
Pretty self-explanatory, really.

I'm CEO at Tailscale, where
we make network problems disappear.
Why would you follow me on twitter? Use RSS.
apenwarr on gmail.com
