
2018-09-18 »
I simulated California housing and learned... about simulators
Here's a post I've been thinking about for a while. I shared it privately with a few people last year, but wanted to find a way to present it that wouldn't be wildly misconstrued. No luck so far.
Summary: Inspired by some conversations at work, I made a variant of my previously popular SimSWE (software engineer simulator) that has our wily engineers trying to buy houses and commute to work. The real estate marketplace is modeled based on Silicon Valley, a region where I don't live but my friends do, and which I define as the low-density Northern Californian suburban area including Sunnyvale, Mountain View, Cupertino, etc, but excluding San Francisco. (San Francisco is obviously relevant, since lots of engineers live in SF and commute to Silicon Valley, or vice versa, but it's a bit different so I left it out for simplicity.)
Even more than with the earlier versions of SimSWE (where I knew the mechanics in advance and just wanted to visualize them in a cool way), I learned a lot by making this simulation. As with all software projects, the tangible output was what I expected, because I kept debugging it until I got what I expected, and then I stopped. But there were more than the usual surprises along the way.
Is simulation "real science"?
Let's be clear: maybe simulation is real science sometimes, but... not when I do it.
Some of my friends were really into Zen and the Art of Motorcycle Maintenance back in high school. The book gets less profound as I get older, but one of my favourite parts is their commentary on the scientific method:
- A man conducting a gee-whiz science
show with fifty thousand dollars’ worth of Frankenstein equipment is not
doing anything scientific if he knows beforehand what the results of his
efforts are going to be. A motorcycle mechanic, on the other hand, who
honks the horn to see if the battery works is informally conducting a true
scientific experiment. He is testing a hypothesis by putting the question
to nature. [...]
The formation of hypotheses is the most mysterious of all the categories of scientific method. Where they come from, no one knows. A person is sitting somewhere, minding his own business, and suddenly - flash! - he understands something he didn’t understand before. Until it’s tested the hypothesis isn’t truth. For the tests aren’t its source. Its source is somewhere else.
Here's the process I followed. I started by observing that prices in Silicon Valley are unexpectedly high, considering how much it sucks to live there, and rising quickly. (Maybe you like the weather in California and are willing to pay a premium; but if so, that premium has been rising surprisingly quickly over the last 15 years or so, even as the weather stays mostly the same.)
Then I said, I have a hypothesis about those high prices: I think they're caused by price inelasticity. Specifically, I think software engineers can make so much more money living in California, compared to anywhere else, that it would be rational to move there and dramatically overpay for housing. The increase in revenue will exceed the increase in costs.
I also hypothesized that there's a discontinuity in the market: unlike, say, New York City, where prices are high but tend to gently fluctuate, prices in Silicon Valley historically seem to have two states: spiking (eg. dotcom bubble and today's strong market) or collapsing (eg. dotcom crash).
Then I tried to generate a simulator that would demonstrate those effects.
This is cheating: I didn't make a simulator from first principles to see what would happen. What I did is I made a series of buggy simulators, and discarded all the ones that didn't show the behaviour I was looking for. That's not science. It looks similar. It probably has a lot in common with p-hacking. But I do think it's useful, if you use the results wisely.
If it's not science, then what is it?
It's part of science. This approach is a method for improved hypothesis formulation - the "most mysterious" process described in the quote above.
I started with "I think there's a discontinuity," which is too vague. Now that I made a simulator, my hypothesis is "there's a discontinuity at the point where demand exceeds supply, and the market pricing patterns should look something like this..." which is much more appropriate for real-life testing. Maybe this is something like theoretical physics versus experimental physics, where you spend some time trying to fit a formula to data you have, and some time trying to design experiments to get specific new data to see if you guessed right. Except worse, because I didn't use real data or do experiments.
Real science in this area, by the way, does get done. Here's a paper that simulated a particular 2008 housing market (not California) and compared it to the actual market data. Cool! But it doesn't help us explain what's going on in Silicon Valley.
The simulator
Okay, with all those disclaimers out of the way, let's talk about what I did. You can find the source code here, if you're into that sort of thing, but I don't really recommend it, because you'll probably find bugs. Since it's impossible for this simulation to be correct in the first place, finding bugs is rather pointless.
Anyway. Imagine a 2-dimensional region with a set of SWEs (software engineers), corporate employers, and various homes, all scattered around randomly.
Luckily, we're simulating suburban Northern California, so there's no public transit to speak of, traffic congestion is uniformly bad, and because of zoning restrictions, essentially no new housing ever gets built. Even the 2-dimensional assumption is accurate, because all the buildings are short and flat. So we can just set all those elements at boot time and leave them static.
What does change is the number of people working, the amount companies are willing to pay them, the relative sizes of different companies, and exactly which company employs a given SWE at a given time. Over a period of years, this causes gravity to shift around in the region; if an engineer buys a home to be near Silicon Graphics (RIP), their commute might get worse when they jump over to Facebook, and they may or may not decide it's time to move homes.
So we have an array of autonomous agents, their income, their employer (which has a location), their commute cost, their property value (and accumulated net worth), and their property tax.
(I also simulated the idiotic California "property tax payments don't change until property changes owners" behaviour. That has some effect, mainly to discourage people from exchanging equally-priced homes to move a bit closer to work, because they don't want to pay higher taxes. As a result, the market-distorting law ironically serves to increase commute times, thus also congestion, and make citizens less happy. Nice work, California.)
The hardest part of the simulator was producing a working real estate bidding system that acted even halfway believably. My simulated SWEs are real jerks; they repeatedly exploited every flaw in my market clearing mechanics, leading to all kinds of completely unnatural looking results.
Perversely, the fact that the results in this version finally seem sensible gives me confidence that the current iteration of my bidding system is not totally wrong. A trained logician could likely prove that my increased confidence is precisely wrong, but I'm not a logician, I'm a human, and here we are today.
The results
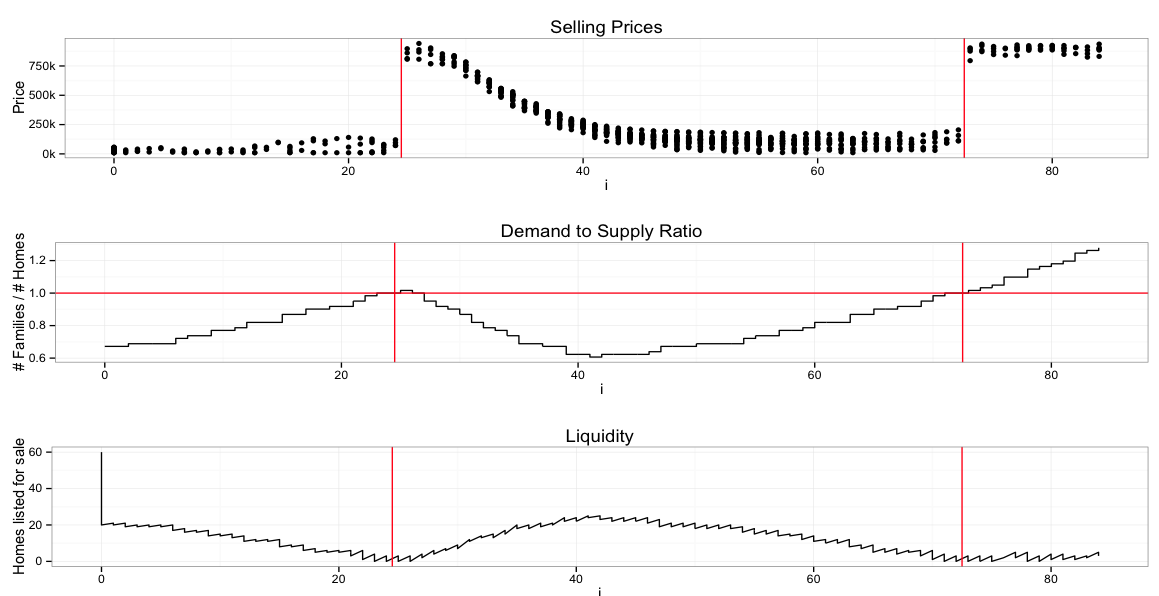
Let's see that plot again, repeated from up above.
The x axis is time, let's say months since start. The top chart shows one dot for every home that gets sold on the open market during the month. The red line corresponds to the 1.0 crossover point of the Demand to Supply Ratio (DSR) - the number of people wanting a home vs the number of homes available.
The second plot shows DSR directly. That is, when DSR transitions from <1.0 to >1.0, we draw a vertical red line on all three plots. For clarity there's also a horizontal line at 1.0 on the second plot.
The third plot, liquidity, shows the number of simulated homes on the market (but not yet sold) at any given moment. "On the market" means someone has decided they're willing to sell, but the price is still being bid up, or nobody has made a good enough offer yet. (Like I said, this part of the simulator was really hard to get right. In the source it just looks like a few lines of code, but you should see how many lines of code had to die to produce those few. Pricing wise, it turns out to be quite essential that you (mostly) can't buy a house which isn't on the market, and that bidding doesn't always complete instantaneously.)
So, what's the deal with that transition at DSR=1.0?
To answer that question, we have to talk about the rational price to pay for a house. One flaw in this simulation is that our simulated agents are indeed rational: they will pay whatever it takes as long as they can still make net profit. Real people aren't like that. If a house sold for $500k last month, and you're asking $1.2 million today, they will often refuse to pay that price, just out of spite, even though the whole market has moved and there are no more $500k houses. (You could argue that it's rational to wait and see if the market drops back down. Okay, fine. I had enough trouble simulating the present. Simulating my agents' unrealistic opinions of what my simulator was going to do next seemed kinda unwieldy.)
Another convenient aspect of Silicon Valley is that almost all our agents are engineers, who are a) so numerous and b) so rich that they outnumber and overwhelm almost all other participants in the market. You can find lots of news articles about how service industry workers have insane commutes because they're completely priced out of our region of interest.
(Actually there are also a lot of long-term residents in the area who simply refuse to move out and, while complaining about the obnoxious techie infestation, now see their home as an amazing investment vehicle that keeps going up each year by economy-beating percentages. In our simulator, we can ignore these people because they're effectively not participating in the market.)
To make a long story short, our agents assume that if they can increase their income by X dollars by moving to Silicon Valley vs living elsewhere, then it is okay to pay mortgage costs up to R*X (where R is between 0 and 100%) in order to land that high-paying job. We then subtract some amount for the pain and suffering and lost work hours of the daily commute, proportionally to the length of the commute.
As a result of all this, housing near big employers is more expensive than housing farther away. Good.
But the bidding process depends on whether DSR is less than one (fewer SWEs than houses) or more than one (more SWEs than houses). When it's less than one, people bid based on, for lack of a better word, the "value" of the land and the home. People won't overpay for a home if they can buy another one down the street for less. So prices move, slowly and smoothly, as demand changes slowly and smoothly. There's also some random variation based on luck, like occasional employer-related events (layoffs, etc). Market liquidity is pretty high: there are homes on the market that are ready to buy, if someone will pay the right price. It's a buyer's market.
Now let's look at DSR > 1.0, when (inelastic) demand exceeds supply. Under those conditions, there are a lot of people who need to move in, as soon as possible, to start profiting from their huge wages. But they can't: there aren't enough homes. So they get desperate. Every month they don't have a house, they forfeit at least (1-R)*X in net worth, and that makes them very angry, so they move fast. Liquidity goes essentially to zero. People pay more than the asking price. Bidding wars. Don't stop and think before you make an offer: someone else will buy it first, at a premium. It's a seller's market.
When this happens, prices settle at, basically, R*X. (Okay, R*X is the mortgage payment, so convert the annuity back to a selling price. The simulator also throws in some variably sized down payments depending on the net worth you've acquired through employment and previous real estate flipping. SWEs gonna SWE.)
Why R*X? Because in our simulator - which isn't too unlike reality - most of our engineers make roughly the same amount of income. I mean, we all know there's some variation, but it's not that much; certainly less than an order of magnitude, right? And while there are a few very overpaid and very underpaid people, the majority will be closer to the median income. (Note that this is quite different from other housing markets, where there are many kinds of jobs, the income distribution is much wider, and most people's price sensitivity is much greater.)
So as a simplification, we can assume R and X are the same for "all" our engineers. That means they simply cannot, no matter how much they try, pay more than R*X for a home. On the other hand, it is completely rational to pay all the way up to R*X. And demand exceeds supply. So they if they don't pay R*X, someone else will, and prices peak at that level.
When DSR dips back below 1.0: liquidity goes up and prices go back down. Interestingly, the simulated prices drop a lot slower than they shot up in the first place. One reason is that most people are not as desperate to sell as they were to buy. On the other hand, the people who do decide to sell might have a popular location, so people who were forced to buy before - any home at any price - might still bid up that property to improve their commute. The result is increasing price variability as people sell off not-so-great locations in exchange for still-rare great locations.
What does all this mean?
First of all, unlike healthier markets (say, New York City) where an increase in demand translates to higher prices, and demand can increase or decrease smoothly, and you can improve a property to increase its resale price, Silicon Valley is special. It has these three unusual characteristics:
- Demand is strictly greater than supply
- Most buyers share a similar upper limit on how much they can pay
- Other than that limit, buyers are highly price insensitive
That means, for example, that improving your home is unlikely to increase its resale value. People are already paying as much as they can. Hence the phenomenon of run-down homes worth $1.5 million in ugly neighbourhoods with no services, no culture, and no public transit, where that money could buy you a huge mansion elsewhere, or a nice condo in an interesting neighbourhood of a big city.
It means raising engineer salary to match the higher cost of living ("cost of living adjustment") is pointless: it translates directly to higher housing prices (X goes up for everyone, so R*X goes up proportionally), which eats the benefit.
Of course, salaries do continue to rise in Silicon Valley, mostly due to continually increasing competition for employees - after all, there's no more housing so it's hard to import more of them - which is why we continue to see a rise in property values at all. But we should expect it to be proportional to wages and stock grants, not housing value or the demand/supply ratio.
In turn, this means that a slight increase in housing supply should have effectively no impact on housing prices. (This is unusual.) As long as demand exceeds supply, engineers will continue to max out the prices.
As a result though, the market price provides little indication of how much more supply is needed. If DSR > 1.0, this simulation suggests that prices will remain about flat (ignoring wage increases), regardless of changes in the housing supply. This makes it hard to decide how much housing to build. Where the market is more healthy, you can see prices drop a bit (or rise slower) when new housing comes on the market, and you can extrapolate to see how much more housing is appropriate.
At this point we can assume "much more" housing is needed. But how much? Are we at DSR=2.5 or DSR=1.001? If the latter, a small amount of added housing could drop us down to DSR=0.999, and then the market dynamics would change discontinuously. According to the simulation - which, recall, we can't necessarily trust - the prices would drop slowly, but they would still drop, by a lot. It would pop the bubble. And unlike my simulation, where all the engineers are rational, popping the bubble could cause all kinds of market panic and adjacent effects, way beyond my area of expertise.
In turn, what this means is that the NIMBYs are not all crazy. If you try to improve your home, the neighbourhood, or the region, you will not improve the property values, so don't waste your money (or municipal funds); the property values are already at maximum. But if you build more housing, you run the risk of putting DSR below 1.0 and sending property values into free fall, as they return to "normal" "healthy" market conditions.
Of course, it would be best globally if we could get the market back to normal. Big tech companies could hire more people. Service industry workers could live closer to work, enjoy better lives, and be less grumpy. With more market liquidity, engineers could buy a home they want, closer to work, instead of just whatever was available. That means they could switch employers more easily. People would spend money to improve their property and their neighbourhood, thus improving the resale value and making life more enjoyable for themselves and the next buyer.
But global optimization isn't what individuals do. They do local optimization. And for NIMBYs, that popping bubble could be a legitimate personal financial disaster. Moreover, the NIMBYs are the people who get to vote on zoning, construction rules, and improvement projects. What do you think they'll vote for? As little housing as possible, obviously. It's just common sense.
I would love to be able to give advice on what to do. It's most certainly a housing bubble. All bubbles pop eventually. Ideally you want to pop the bubble gently. But what does that mean? I don't know; an asset that deteriorates to 30% of its current price, slowly, leaves the owner just as poor as if it happened fast. And I don't know if it's possible to hold prices up to, say, 70% instead of 30%, because of that pesky discontinuity at DSR=1.0. The prices are either hyperinflated, or they aren't, and there seems to be no middle.
Uh, assuming my simulator isn't broken.
That's my hypothesis.
Why would you follow me on twitter? Use RSS.